
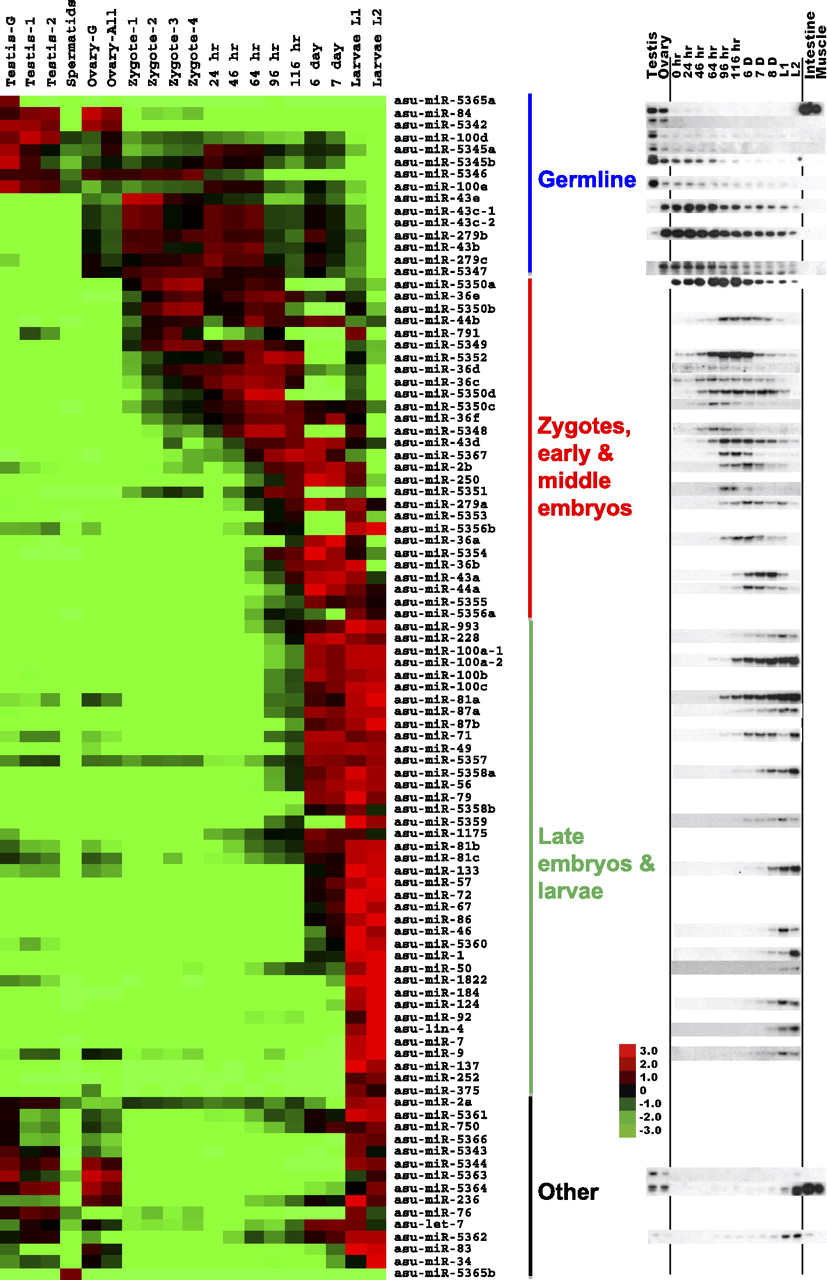
Figure 4.
Dynamic miRNA expression profiles in Ascaris development. Heatmap and Northern Blot expression profiles of Ascaris miRNAs. For each miRNA, colors represent log2 values of fold changes to the average read frequencies of the miRNA during development. Heatmap expression profiles represent normalized mature miRNA read numbers.


