
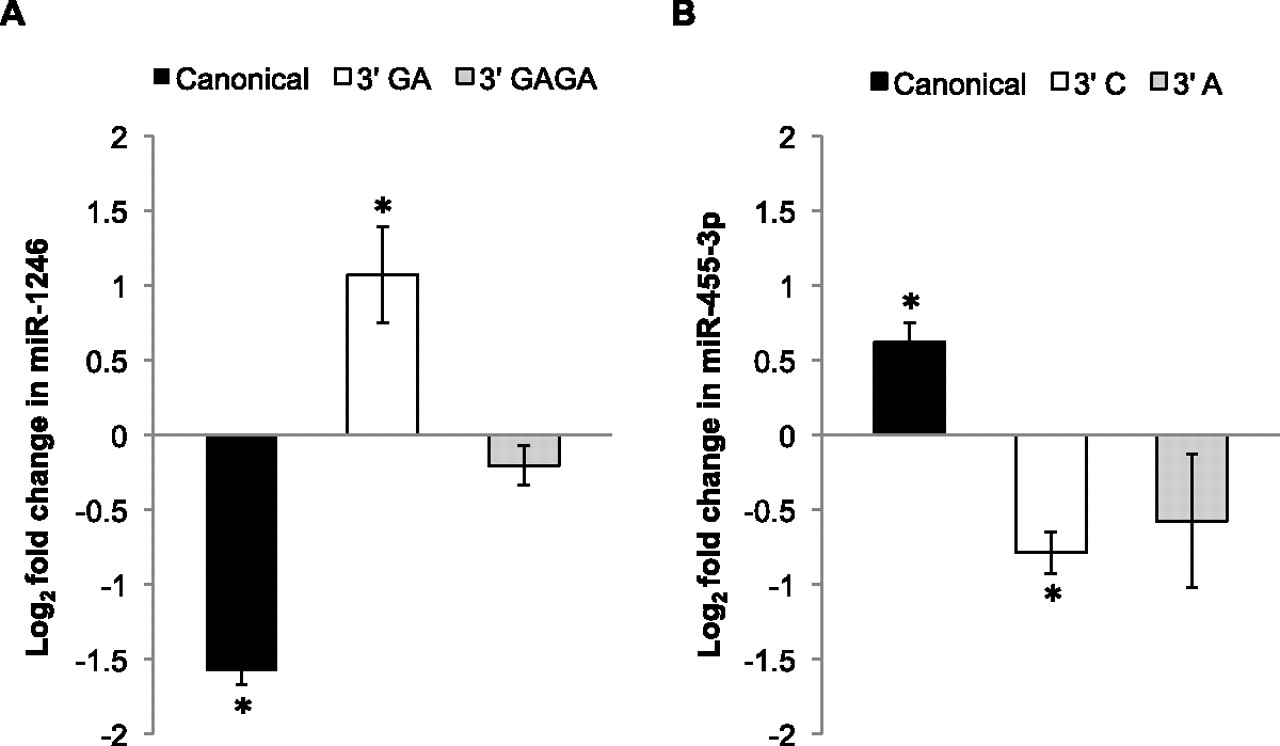
MicroRNA additions are altered in response to differentiation. The NanoString nCounter assay was used to profile differential expression of miRNA 3′ variants in undifferentiated versus differentiated H1 human embryonic stem cells. MicroRNAs were filtered by requiring at least 50 counts in at least two of the three assays (canonical, V1, or V2) in both the undifferentiated and differentiated hESC data sets. The plotted miRNAs are the two showing the greatest change in the fractional abundance of 3′ variants following differentiation. Error bars represent ±SD of the fold change across two biological replicates, and asterisks indicate P-values <0.05. Supplemental Table S7 provides data corresponding to all 10 miRNAs that met filtering criteria, including three additional miRNAs showing significant changes in relative variant abundance. (A) The graph shows the fold change in the canonical and 3′ variant forms of miR-1246. For miR-1246, differentiation is associated with a significant increase in the fractional abundance of the 3′ GA variant, and a corresponding decrease in the canonical sequence. (B) For miR-455-3p, differentiation is associated with a significant decrease in the abundance of the 3′ C variant and a corresponding increase in the canonical miRNA fractional abundance.


