
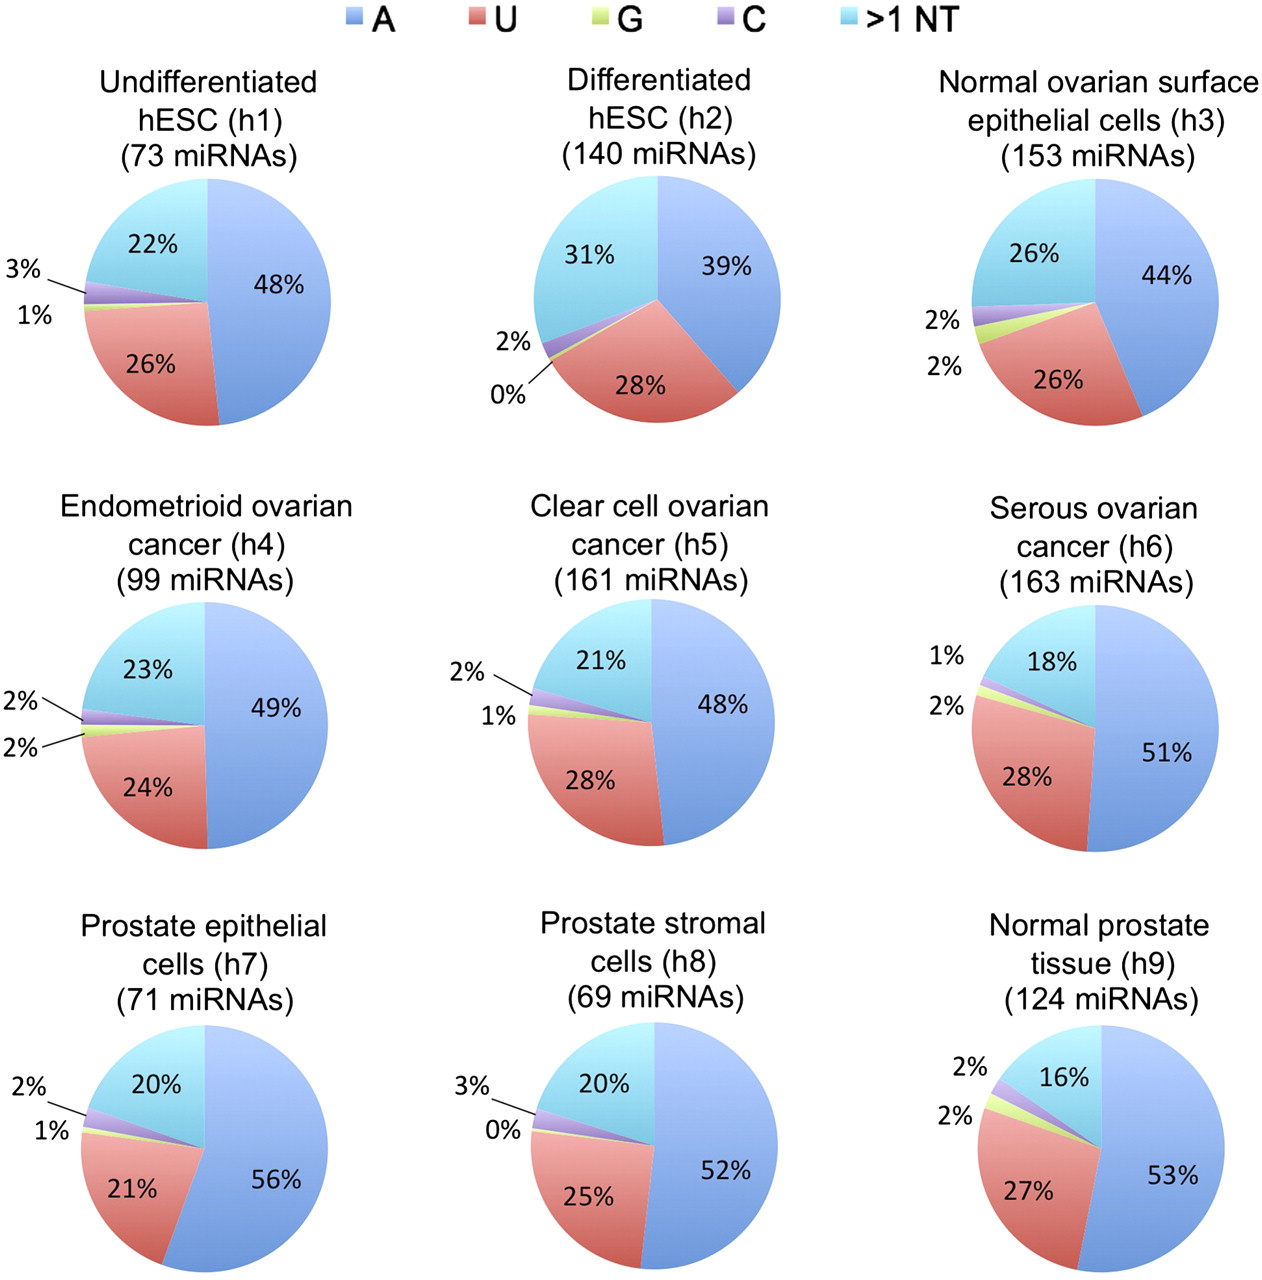
Distribution of added nucleotides observed in nine human small RNA sequencing data sets. Distribution was calculated based on miRNAs with an abundance of at least 10 reads, and the number of miRNAs which qualified is given in parentheses for each pie chart. Fractional contribution of each nucleotide addition was calculated for each miRNA, and then averaged for all the miRNAs in each data set. Pie charts indicate what fraction of total additions each mononucleotide represented (on average) for each data set, and all multinucleotide additions were counted in the >1 category. Parenthetical data set identifiers refer to descriptions provided in Supplemental Table S1.


