
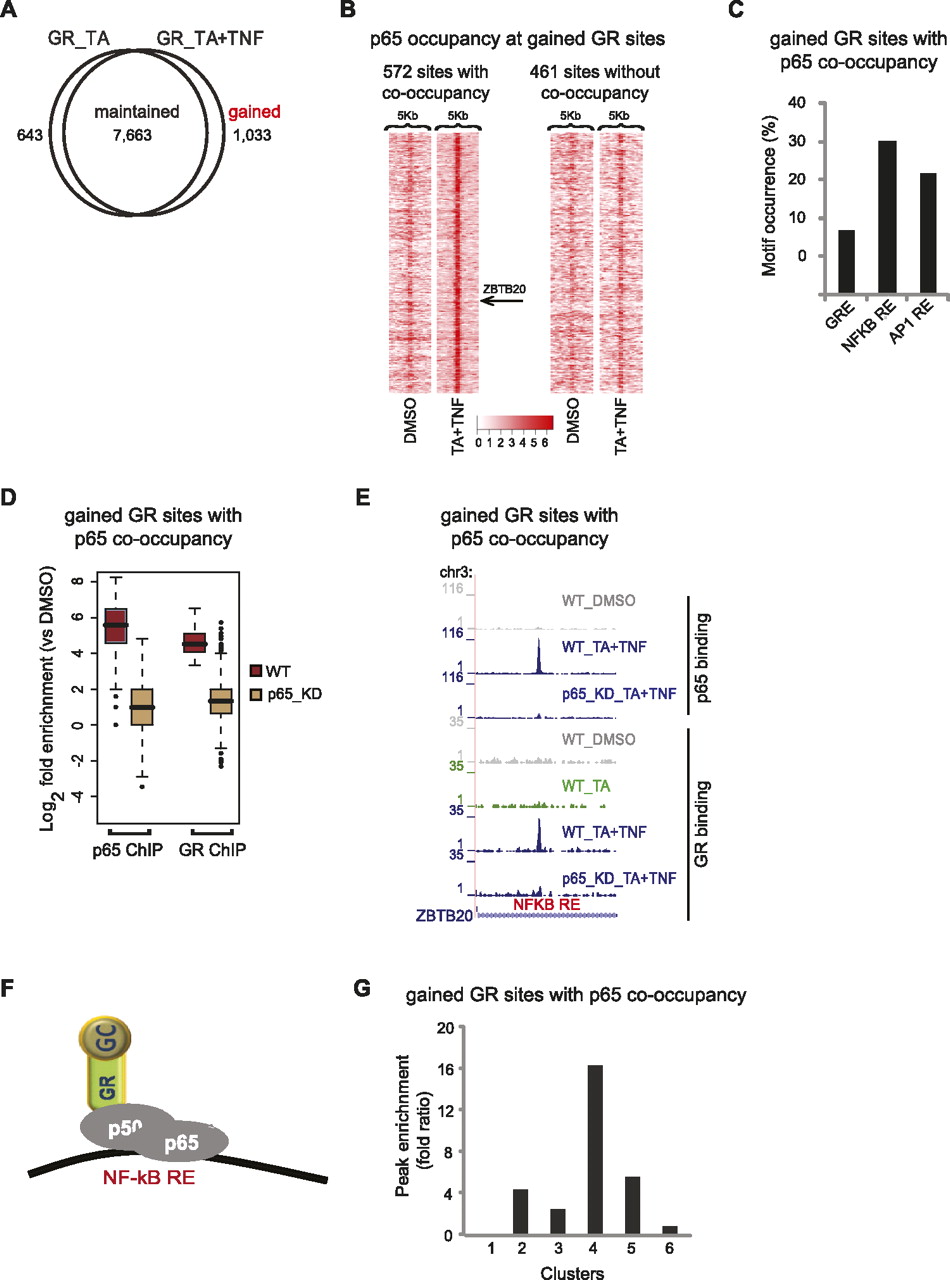
Gained GR-binding sites and their correlation to gene expression profile. (A) Profile of GR-binding sites. Venn diagram of the overlap of GR sites detected upon treatment with TA or TA + TNF. (B) Tag density maps depicting the pattern of p65 occupancy around (peak mode ±2.5 kb) gained GR sites. Color density indicates the level of p65 occupancy (square root of tag density; see scale below) in a 250-bp window. The position of the example presented in E (ZBTB20) is indicated. (C) Motif occurrence within gained GR sites co-occupied by p65. The bar graph shows the percentage of sites containing the indicated motifs. (D) Boxplots of GR and p65 tag counts distributed under peak locations (log2 scale) of gained GR sites co-occupied by p65, upon TA + TNF treatment, in WT cells and the respective tag distributions under the same locations in p65_KD cells. (E) GR and p65 ChIP-seq data illustrate binding of GR and p65 at gained GR sites co-occupied by p65, detected upon the indicated treatments, in WT and p65_KD cells. Data were viewed in the UCSC Genome Browser. The maximum number of overlapping tags, representing peak height, is indicated on the y-axis. (F) Model of GR and p65 interaction at gained GR sites co-occupied by p65. (G) Enrichment of gained GR sites co-occupied by p65 that are assigned to the genes of each cluster. Peak enrichment fold ratio represents the ratio of the nonrandom enrichment (ratio of assigned binding sites to the total number of genes in each cluster) to the random enrichment (parallel enrichment calculation for 100 random sets of nonregulated genes, performed to assess the statistical significance of the peak enrichment analysis).


