
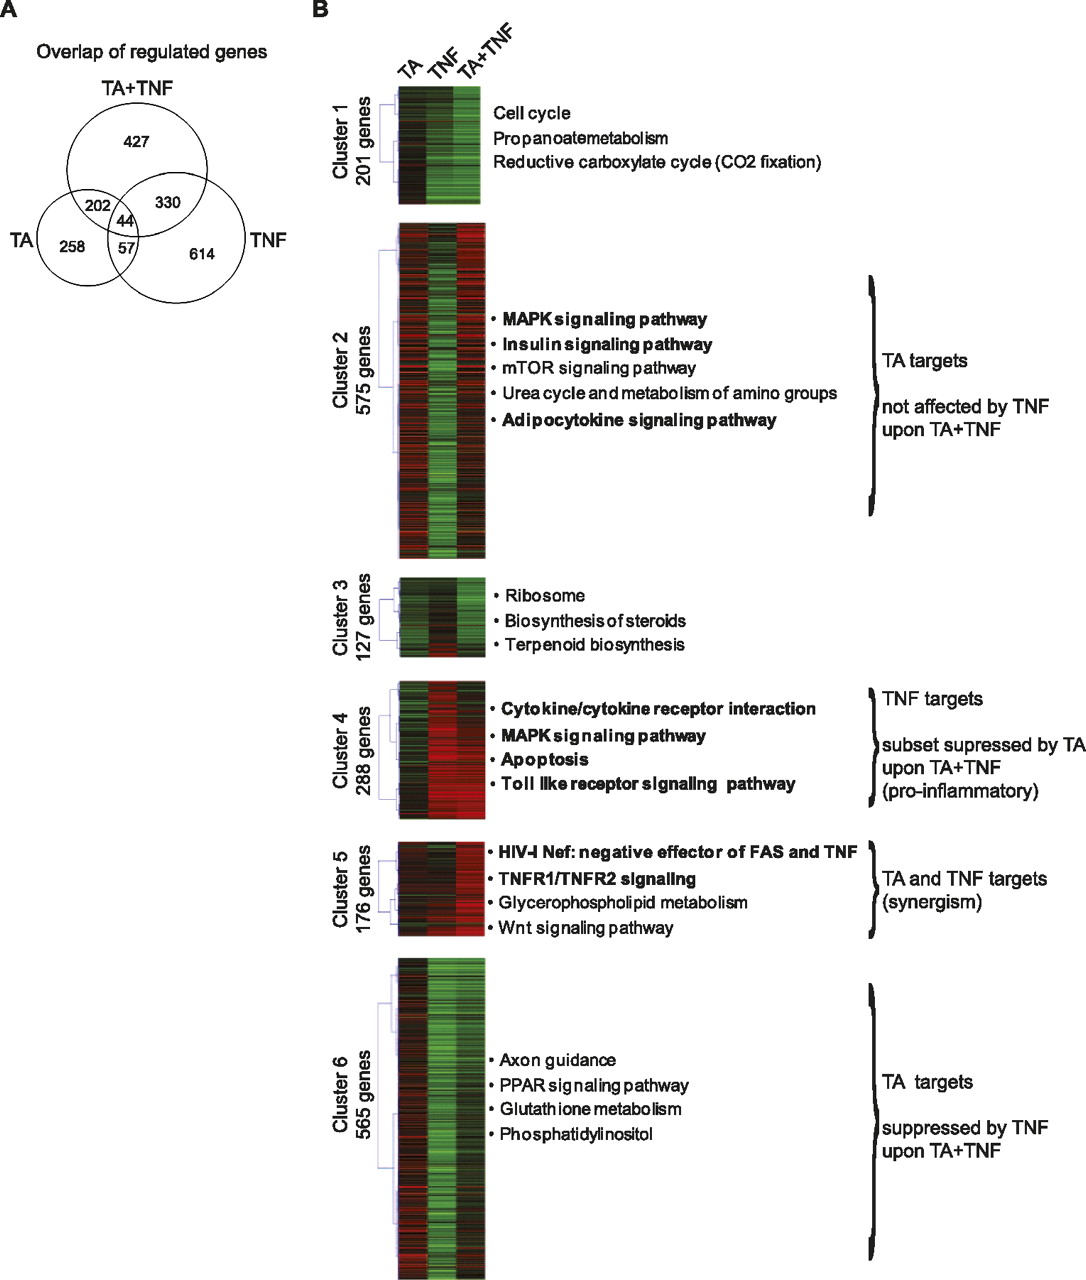
Cluster analysis of genes regulated upon TA and/or TNF treatment. (A) Comparison of the genes regulated by TA, TNF, and TA + TNF. Venn diagram represents the overlap between the genes regulated upon each treatment. (B) Cluster analysis of the regulated genes. Using k-means clustering, the 1932 collectively regulated genes were clustered into six distinct clusters based on their changes in RNAPII occupancy upon treatment with TA, TNF, and TA + TNF, relative to DMSO, as depicted by the heatmap. The number of genes in each cluster is indicated. The cluster profiles are as follows: (Cluster 1) largely unaffected by TA and down-regulated by TNF and to a higher extent by TA + TNF; (Cluster 2) up-regulated by TA and TA + TNF, and down-regulated by TNF; (Cluster 3) up-regulated by TNF and down-regulated by TA and TA + TNF; (Cluster 4) largely unaffected by TA and strongly up-regulated in the presence of TNF (a subset of these genes is down-regulated by TA + TNF); (Cluster 5) mildly up-regulated by TA or TNF and strongly up-regulated by TA + TNF; (Cluster 6) up-regulated by TA and down-regulated by TNF and to a lesser extent by TA + TNF. The main characteristics of genes in clusters 2, 4, 5, and 6 are indicated at right.


