
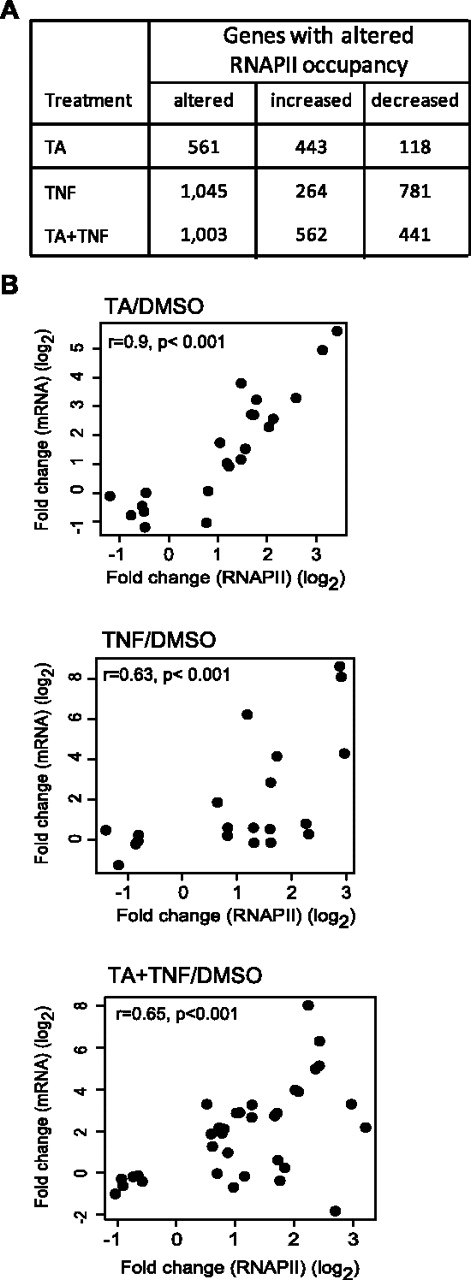
Figure 1.
Genes with altered RNAPII occupancy upon TA and/or TNF treatment. (A) The number of genes with altered RNAPII occupancy (increased and decreased) in response to TA, TNF, and TA + TNF treatment, as indicated. (B) RNAPII occupancy vs mRNA levels. Scatter plots depicting the Pearson correlation (r) between changes in mRNA levels (y-axis) and in RNAPII occupancy (x-axis) for randomly selected regulated genes. Changes in mRNA and RNAPII occupancy were expressed as fold induction of the indicated treatment over DMSO (in log2 scale).


