
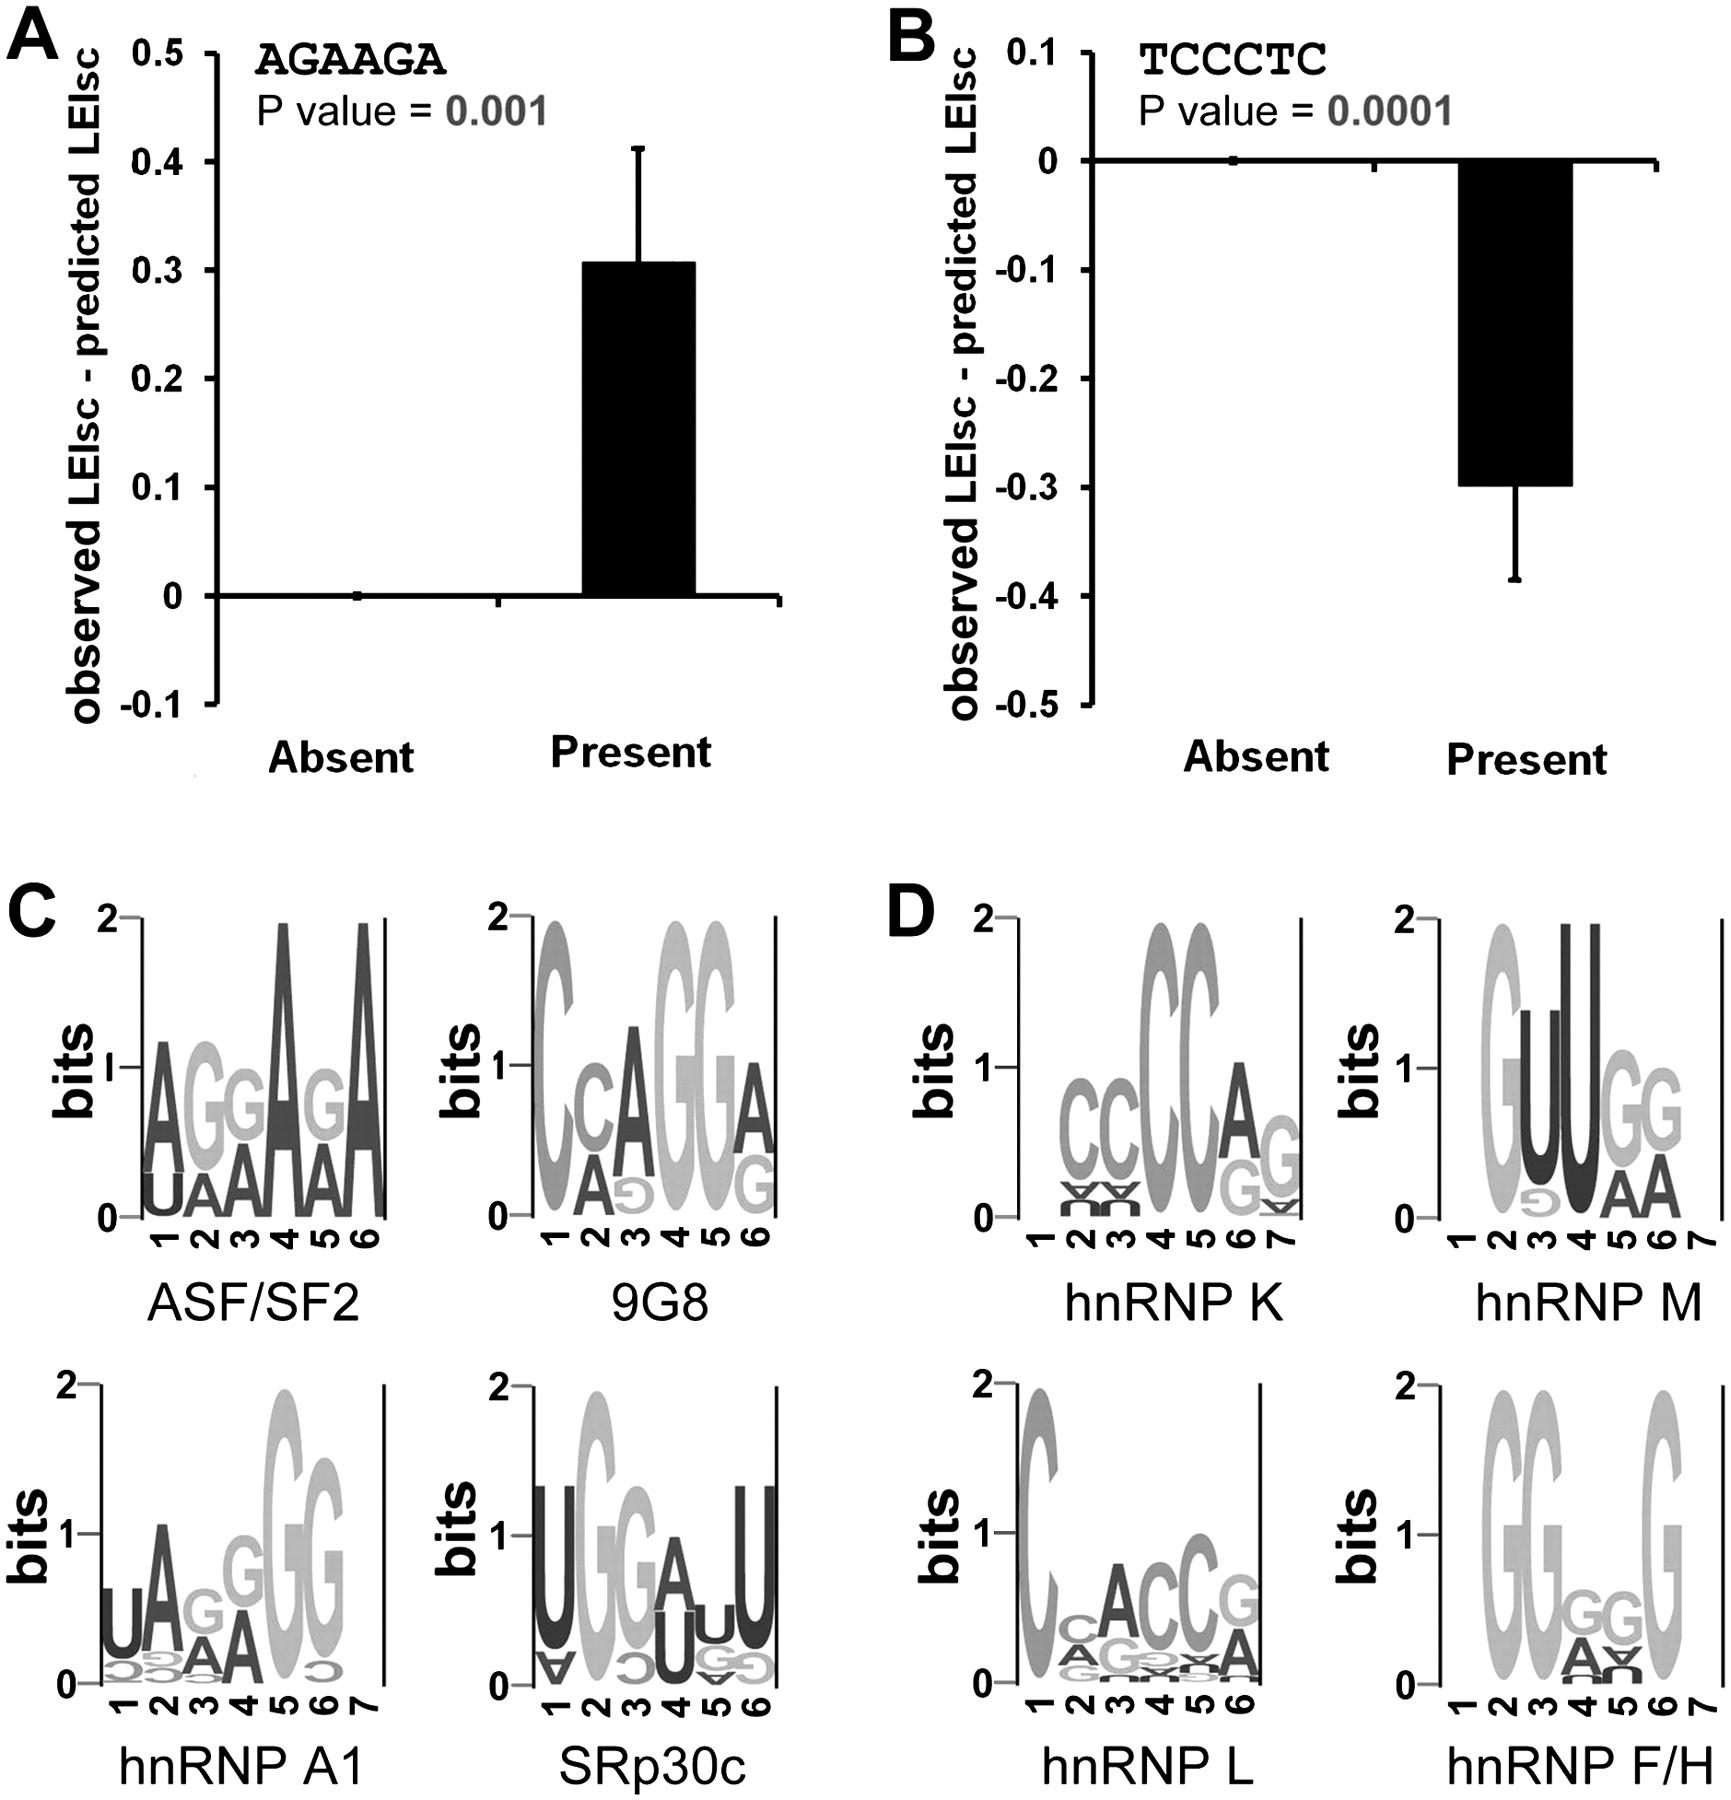
Six-mers that are candidates for combinatorial requirements. The hypothesis here is that the target 6-mer is influenced by a partner sequence within the 16-nt summed region, leading to a deviation from the additive model. (A) One example of a 6-mer (AGAAGA) that may have positive synergy with another within the 16-nt summed region. In the case of positive synergy, the observed splicing strength (LEIsc) would be significantly higher than that predicted whenever AGAAGA is present in the 16-nt region. The predicted LEIscs were converted from the splicing strength predicted by the additive model shown in Figure 4D by linearly scaling the values to fit the scale of the observed LEIscs. The total 20,480 molecules were classified into two categories: those in which this 6-mer was absent and those in which it was present. The average of (observed LEIsc—predicted LEIsc) in each category is shown. P-values were calculated using a t-test. Error bars are the SEM. (B) One example of a 6-mer (TCCCTC) that may have negative synergy with another within the 16-nt summed region. In this case, the observed splicing strength (LEIsc) would be significantly lower than that predicted whenever TCCCTC is present. P-values were calculated using a t-test. Error bars are the SEM. (C) Clusters of 6-mers that may have positive synergy with others and resemble the binding sites of known splicing factors. (D) Clusters of 6-mers that may have negative synergy with others and resemble the binding sites of known splicing factors.


