
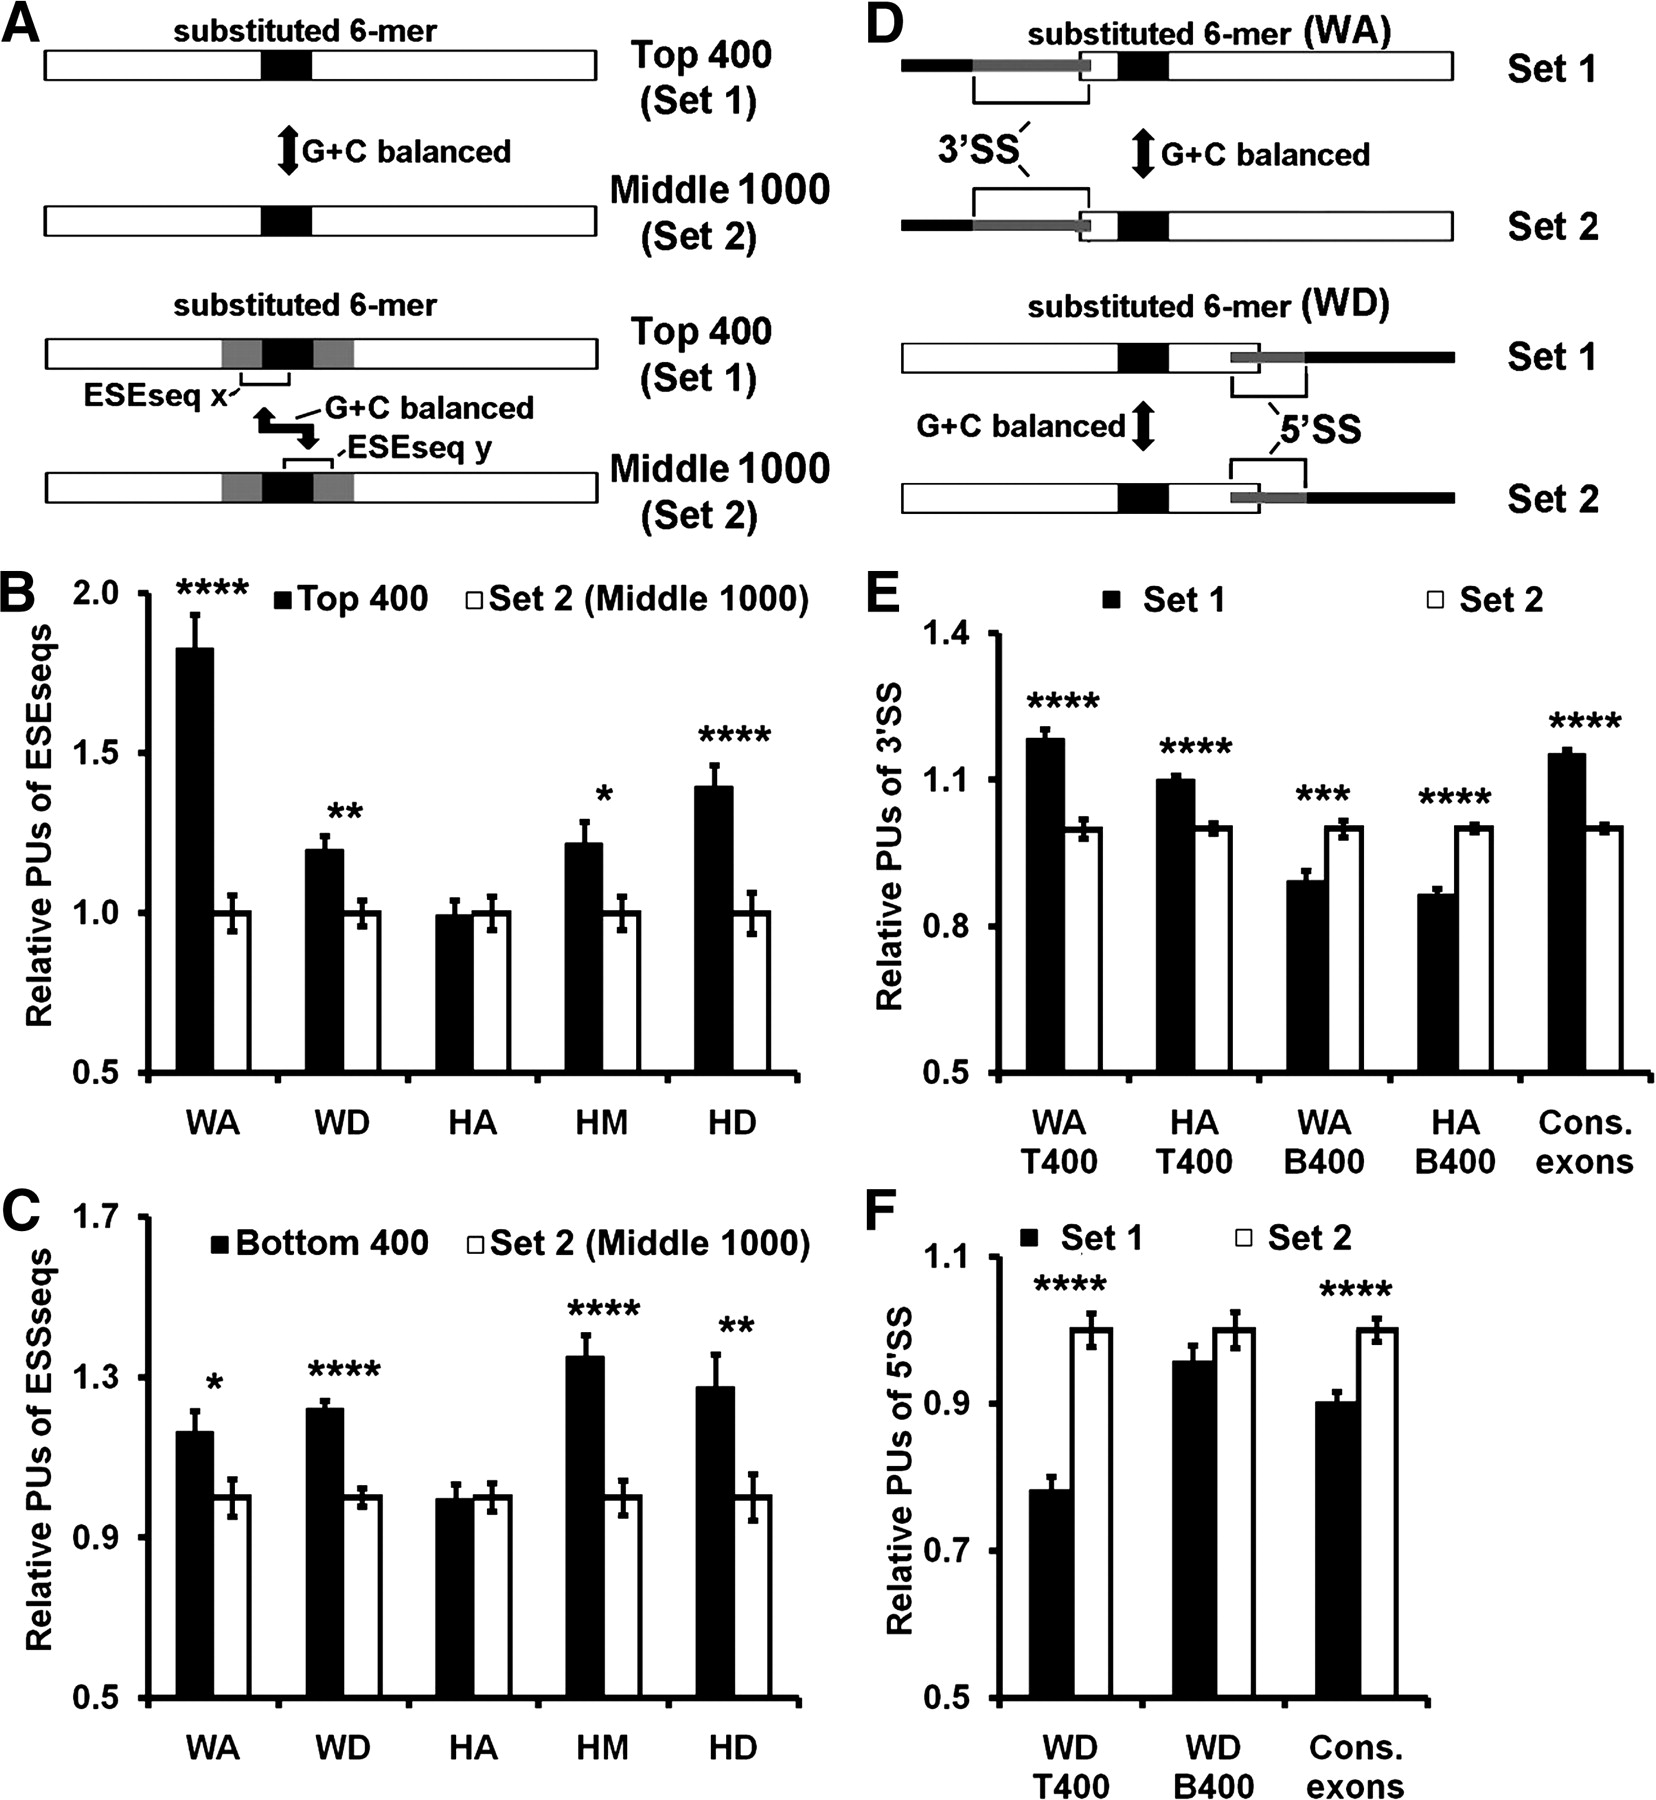
Secondary structure effects of 6-mer substitution. (A) Maps for B and C. (B) Effective ESEseqs tend to be single stranded. Single strandedness of ESEseqs was measured by the probability of being unpaired (PU) (Hiller et al. 2007). (Filled bars) All ESEseqs in the 16-nt region of the top scoring 400 transcripts; (open bars) all ESEseqs in the 16-nt region drawn from the middle scoring 1000 transcripts, as G+C–matched controls. The mean PU of each control was set to unity. (C) Effective ESSseqs tend to be single stranded. As in B except that filled bars show all ESSseqs in the 16-nt region of the bottom scoring 400 transcripts. (D) Maps for E and F. (E) The 3′ splice site (SS) tends to be single stranded in high-scoring transcripts. This analysis was restricted to locations WA and HA, where the substitution is close enough to the 3′SS (−14/+1) to influence local folding. T400 (set1): comparison of highly spliced transcripts with controls (set2) as in B. B400 (set1): comparison of poorly spliced transcripts with controls (set2) as in C. Bars on right: average PU of the 3′SS from constitutive exons (filled) and G+C–matched pseudo exons (open). (F) The 5′SS tends to be double stranded in high-scoring transcripts. This analysis was restricted to location WD, which is close enough to the 5′SS (−3/+6) to influence local folding. Data is presented as in E. Bars on right: average PU of the 5′SS from constitutive exons (filled) and G+C–matched pseudo exons (open). (*) P < 5 × 10⁻²; (**) P < 10−2; (***) P < 10−3; (****) P < 10−4 (t-test). Error bars, SEM. See Methods for details.


