
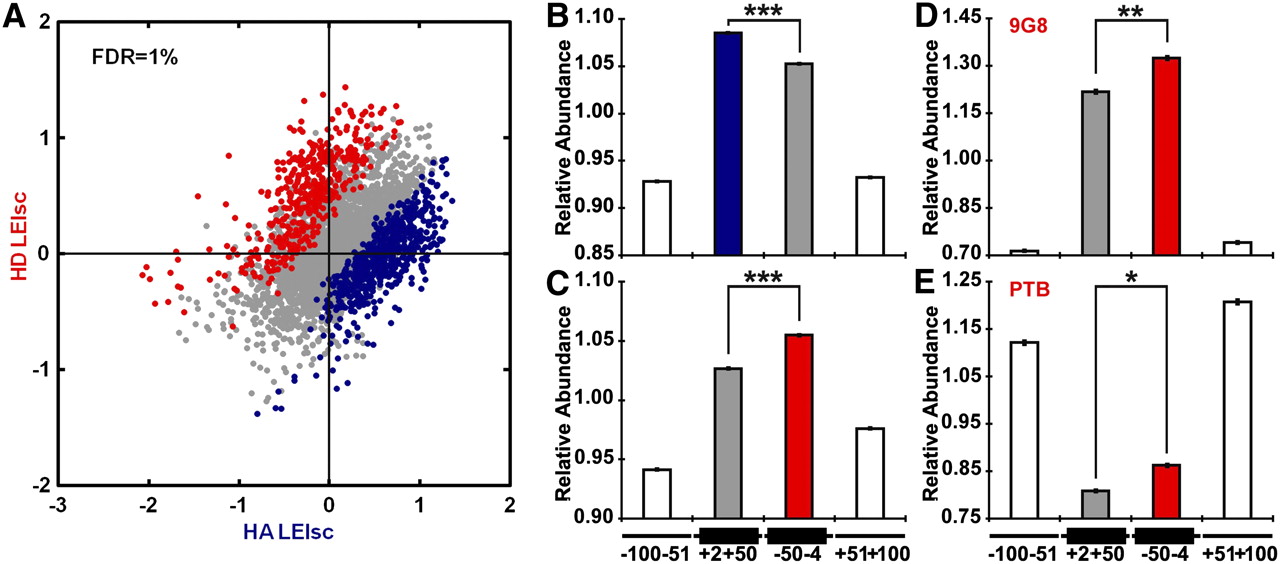
Detection of 6-mers exhibiting positional bias. (A) Scatter plot of 6-mer LEIscs in the HA and HD contexts. Six-mers eliciting LEIsc values that were significantly (FDR = 1%) higher in the HA context are blue and those significantly higher in the HD context are red. (B) HA context preferred motifs (blue in A) are more highly enriched in the exonic region closer to the 3′SS in human constitutive exons. The average 6-mer density in the four regions (−100 nt to −51 nt in the upstream intron, +2 nt to +50 nt the exon body, −50 nt to −4 nt in the exon body, and +51 nt to +100 in the downstream intron) was set equal to one and other values adjusted accordingly. (C) HD context preferred motifs (red in A) are more highly enriched in the exonic region closer to the 5′SS. The data are presented as in B. (D) HD context preferred motifs resembling 9G8 binding sites are more highly enriched in the exonic region closer to the 5′SS in human constitutive exons. (E) HD context preferred motifs resembling PTB binding sites are less depleted in the exonic region closer to the 5′SS. (*) P < 3 × 10⁻¹³; (**) P < 2 × 10⁻¹⁶; (***) P < 3 × 10−40 (t-test). Error bars, SEM.


