
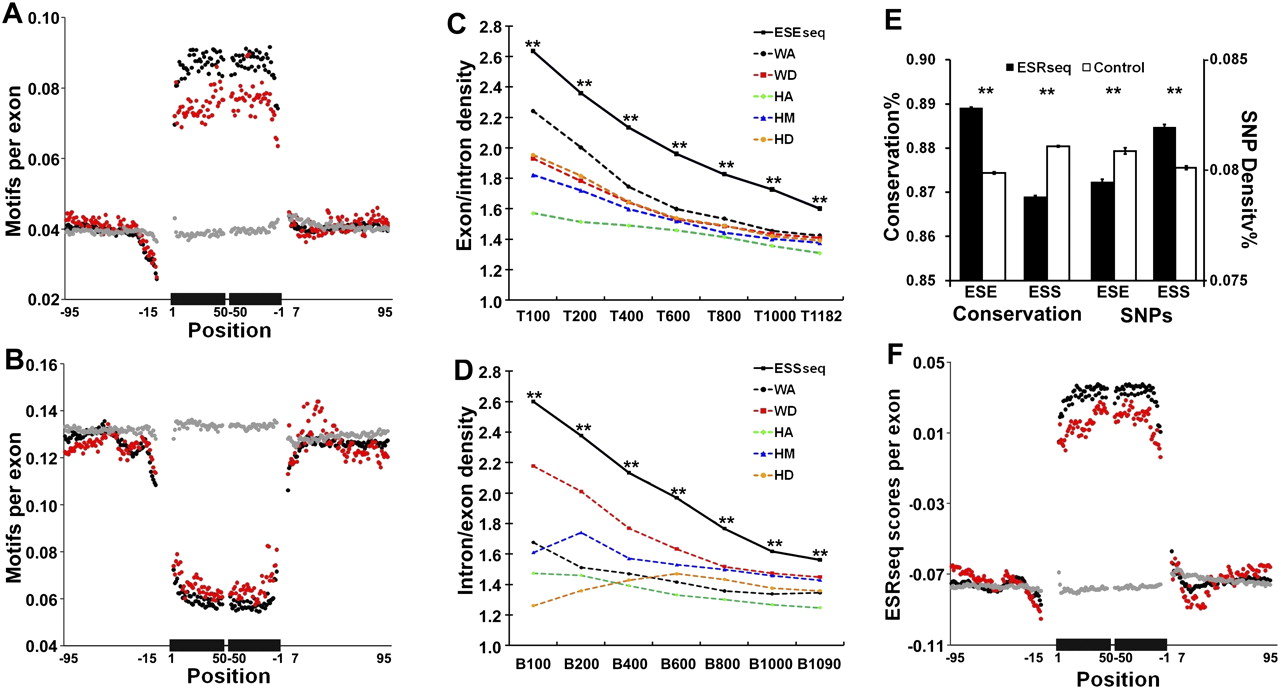
Genomic characteristics of ESEseqs and ESSseqs. (A) Frequency of the top 400 ESEseqs in human constitutive (119,006, black), alternative cassette (25,807, red), and pseudo exons (134,994, gray), all >50 nt, and their flanking introns. The frequency of the top 400 6-mers per exon at each nucleotide position is shown on the y-axis. The black bars on the x-axis represent a composite exon comprising 50 nt downstream from the 3′ splice site abutted to 50 nt upstream of the 5′ splice site. Thin lines indicate intronic flanks. Positions overlapping the 3′ and 5′ splice sites (−14 to +1 and −3 to +6) were excluded. (B) Frequency of the bottom 400 ESSseqs, presented as in A. (C) ESEseqs are more highly enriched in constitutive exons than are the top performing 6-mers from any individual location. (T) Top; (**) P < 10−136 (χ2 test). (D) ESSseqs are more highly enriched in intronic regions (note the reversal of the ratio on the y-axis) than are the bottom performing 6-mers from any individual location. (B) Bottom; (**) P < 10−140 (χ2 test). (E, left) ESEseqs are conserved in macaque-human evolution and ESSseqs are not. (Right) SNP density is lower in ESEseqs and higher in ESSseqs. Only non-CpG containing ESRseqs and ESSseqs (filled bars) were used; the controls (open bars) were scrambled non-CpG-containing versions of the ESRseqs. (**) P < 10−140 (χ2 test). Analyses that included CpG-containing 6-mers yielded similar results (Supplemental Fig. 5A,B). Error bars, SEM. (F) Distribution of average ESRseq scores in and around human constitutive (black), alternative cassette (red), and pseudo exons (gray).


