
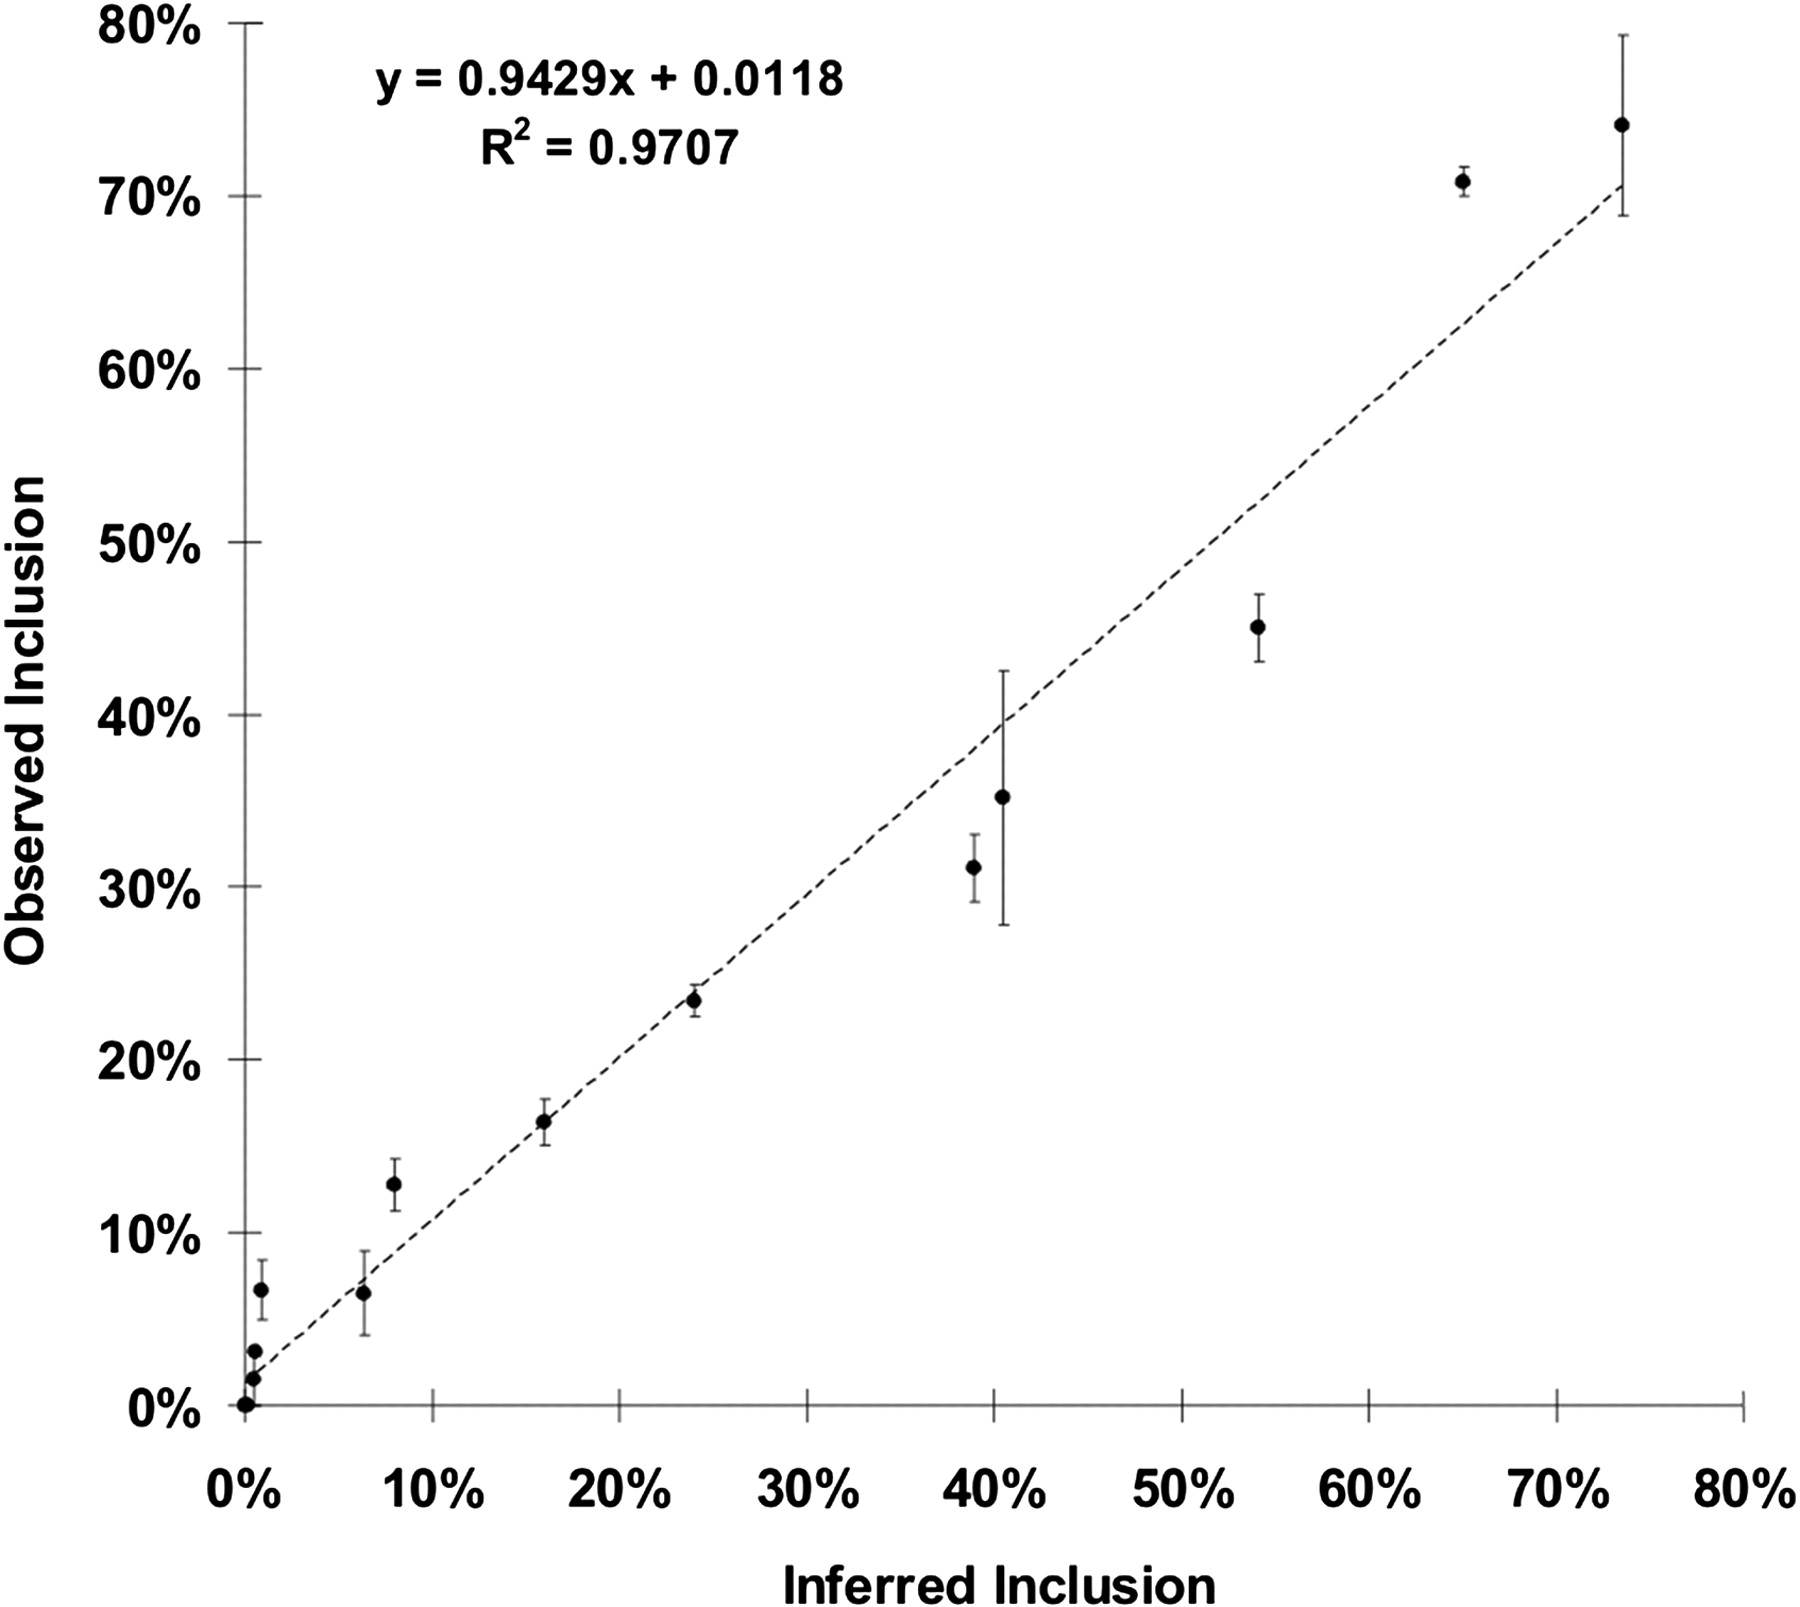
Experimental validation of the effect of substituting individual 6-mer sequences. The observed percent inclusion resulting from testing 14 6-mers at the WA location (y-axis) agreed well with those calculated from the digital data (x-axis) as described in Methods. Tested 6-mers were chosen from the entire range of EI values observed. After transfection into HEK293 cells, RT–PCR products in ethidium bromide-stained gels were quantified by ImageJ. Error bars show the range from duplicate transfections. Observed inclusion is 100 × included/(included + skipped). The observed percent inclusion of 36 additional 6-mers from the WD, HA, HM, and HD locations also agreed well with those calculated from the digital data (Supplemental Fig. 3A–D). The locations are depicted schematically in Figure 2A.


