
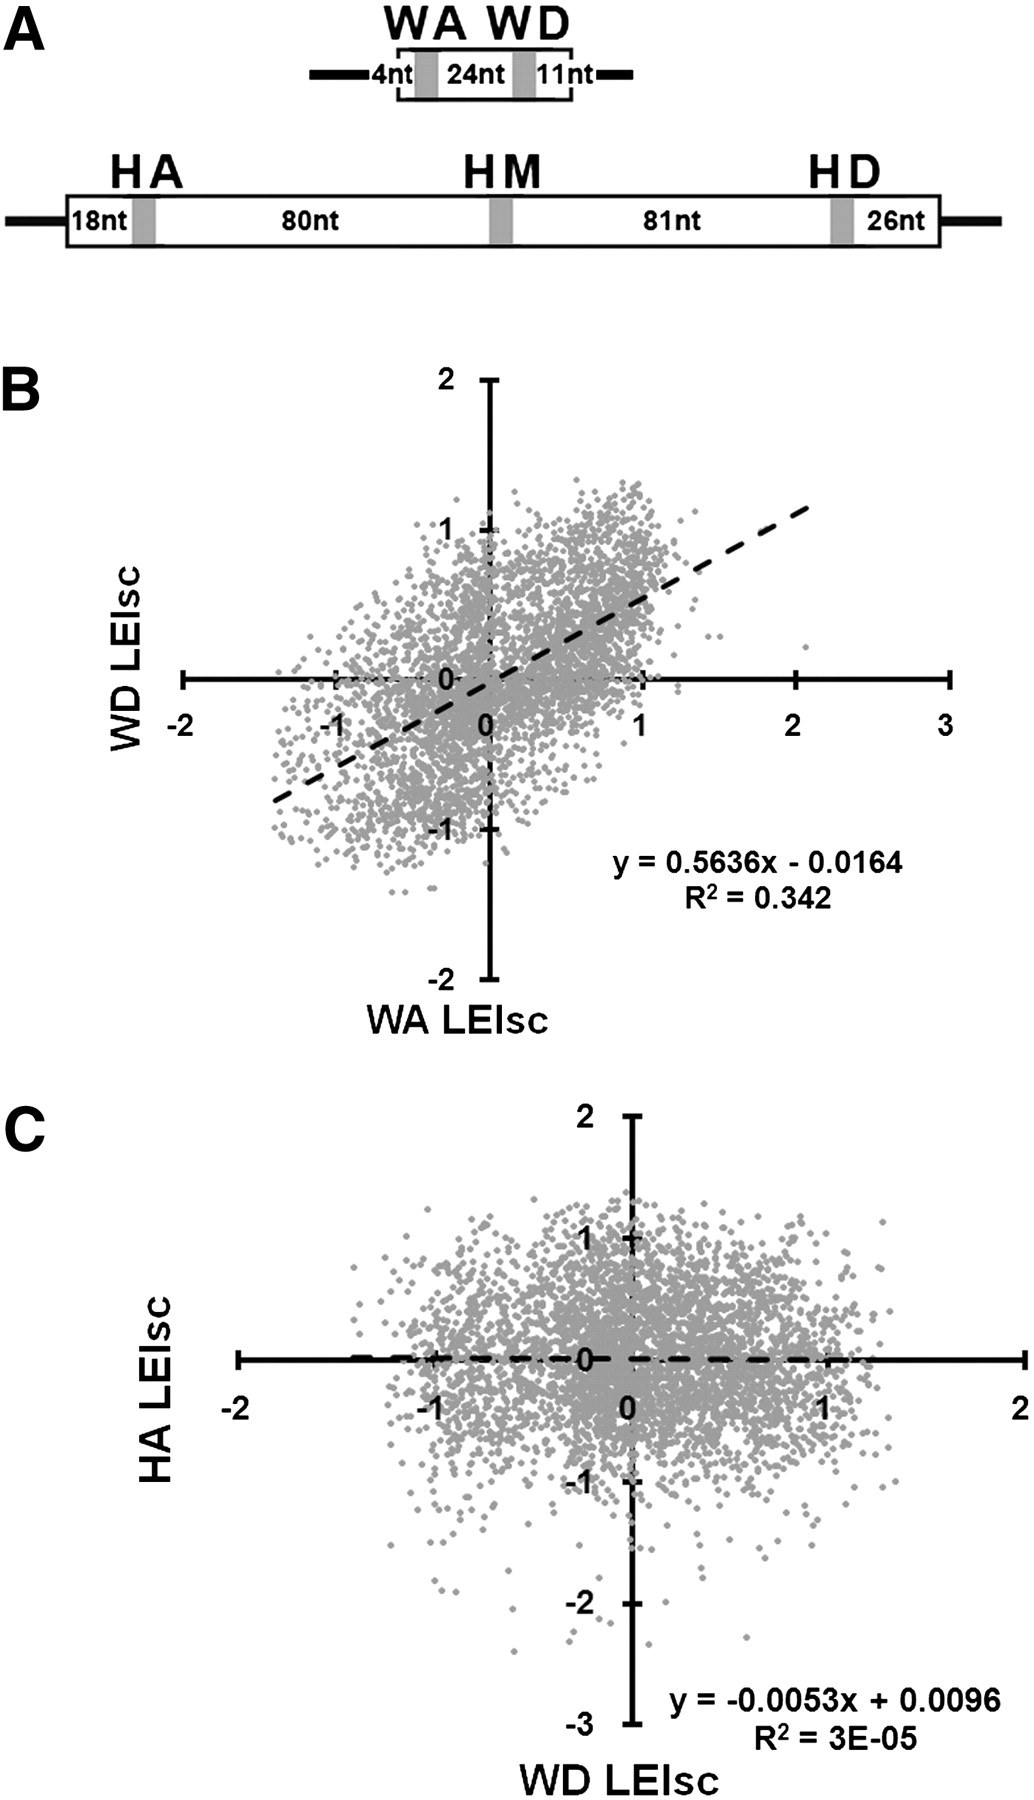
Figure 2.
Examples of the effect of location on the splicing behavior of substituted pre-mRNA molecules. (A) The five locations in exons WT1-5 (top, 51 nt) and Hb2 (bottom, 223 nt). (B) The best correlation of the effect of 6-mer substitutions (LEIsc, log of the enrichment index, scaled) was between the WA and WD locations (R2 = 0.34). (C) The worst correlation was between WD and HA (R2 = 3 × 10⁻⁵). The dashed line is the least squares regression fit. The results for all five locations are shown in Supplemental Figure 1.


