
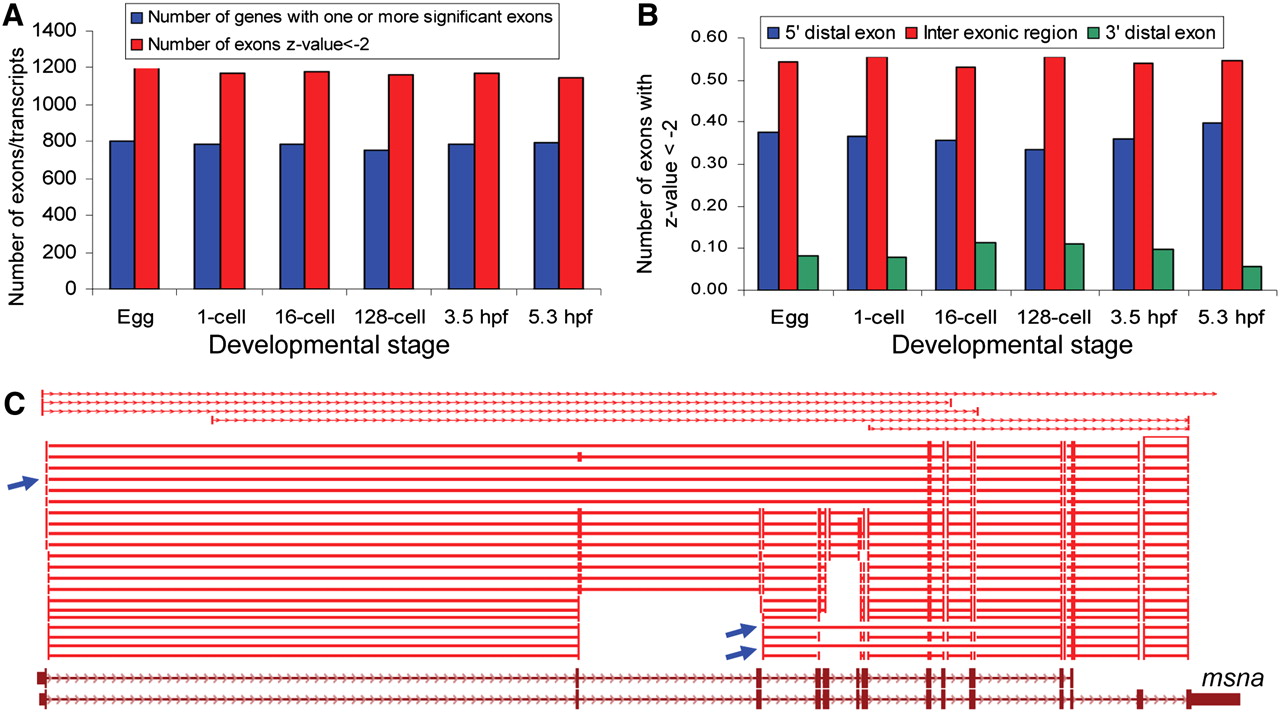
Figure 6.
Analysis of splice variants. (A) The number of alternatively spliced transcripts (blue bars) and alternatively spliced exons (red bars) at each stage. Both were stable through all stages. (B) Location of alternatively spliced exons in all transcripts. Most spliced exons were located between exons, but with a substantial fraction corresponding to distal 5′ exons. (C) Splice variants in msna at 5.3 hpf. Junction mapping shows skipping of exons 1 to 8, 2 to 8, and 3 to 11 (blue arrows). Di-tags (red bars with arrowheads) support the presence of several splice isoforms.


