
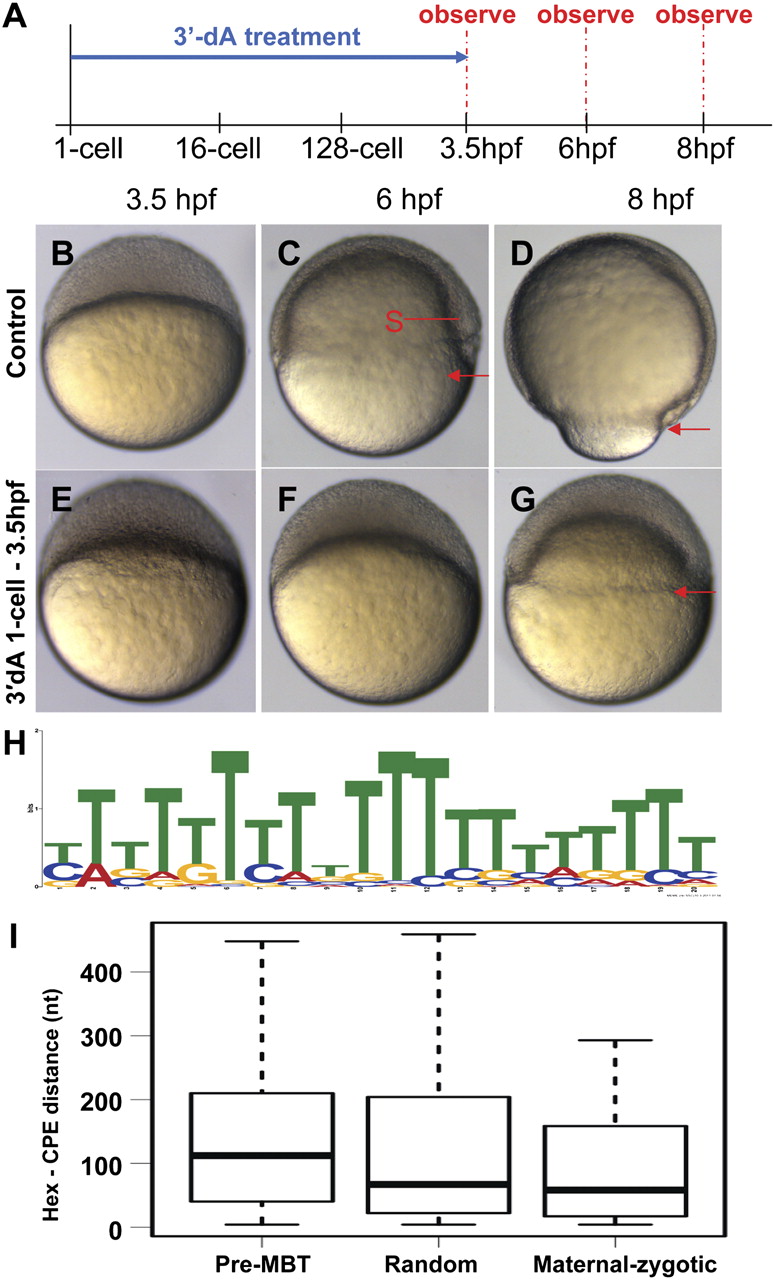
Inhibition of cytoplasmic polyadenylation by 3′-dA. (A) Schematic of treatments at various developmental time frames. Horizontal arrows represent exposure to 3′-dA. (B–D) Control embryos showing normal development. (Red arrows) The level of marginal cells, signifying the progress of epiboly. Note the presence of embryonic shield (S) at the 6-hpf stage. (E–G) Embryos treated with 3′-dA from the 1-cell to 3.5-hpf stage, showing a severe delay in development. (H) U-rich motif found in genes of the pre-MBT supercluster using the MEME algorithm. (I) Distance between Hex and CPE in different groups of genes. The boxplot shows the distribution of the shortest distance between any Hex and CPE pair in the 3′ UTR of genes in maternal–zygotic and pre-MBT clusters, as well as in a randomly chosen group of genes (random). Notice the longer distance between the two elements in the pre-MBT group compared to the other two groups.


