
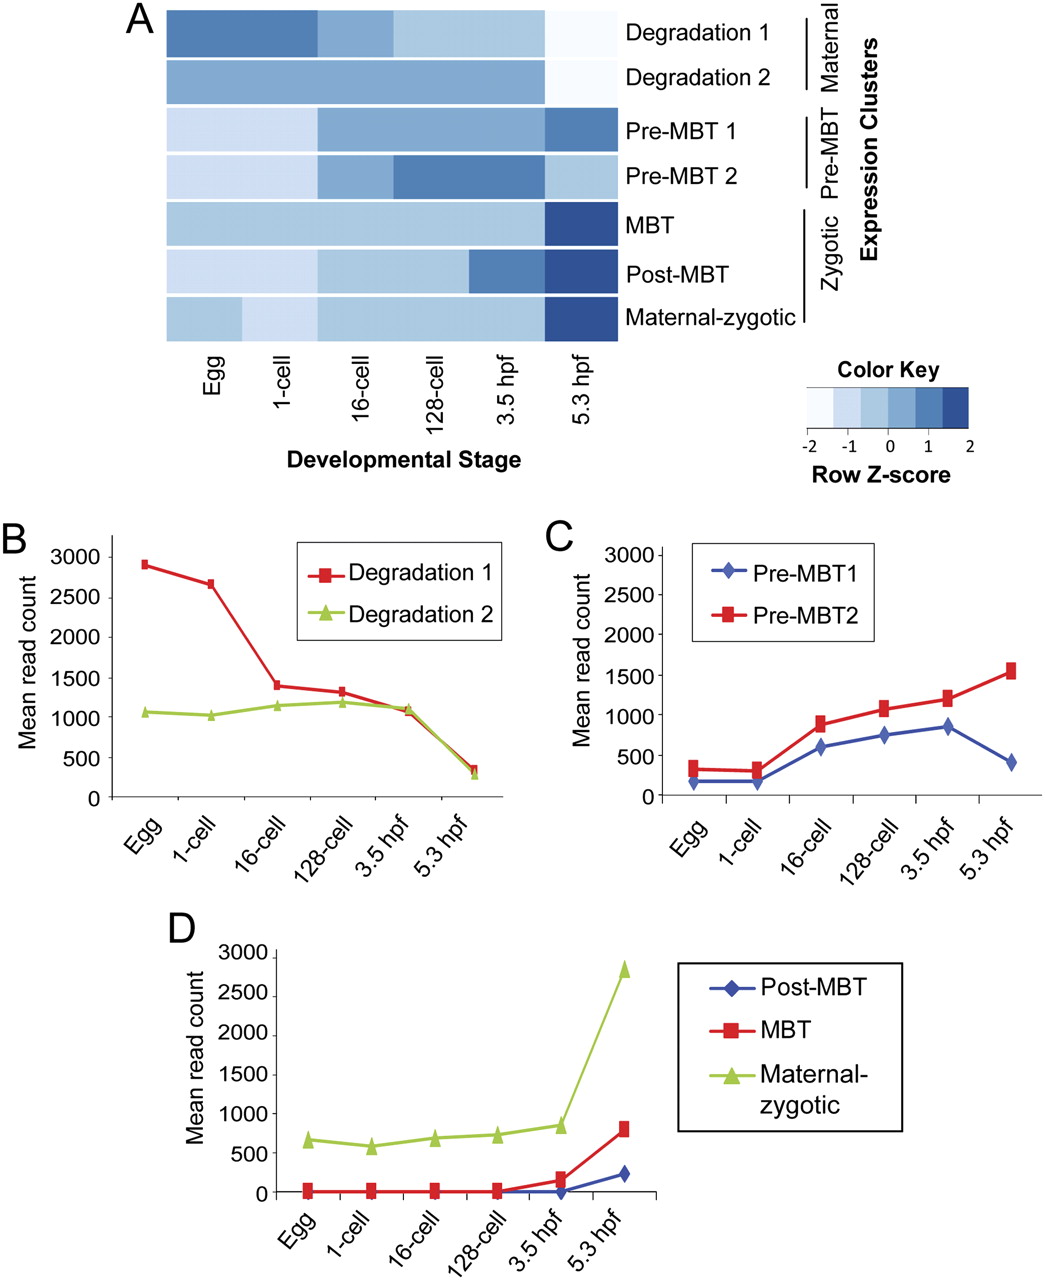
Expression clusters of early developmental genes. (A) Heatmap showing distinct expression profiles of different clusters at each developmental stage. Values were scaled for each cluster; color intensity represents expression level relative to its own cluster's average. (B–D) Graphs showing mean expression of all genes in each cluster from the egg to the 5.3-hpf stage. (B) Two clusters of the maternal supercluster, showing two different degradation patterns. (C) Two clusters of the pre-MBT supercluster, both characterized by a significant increase at the 16-cell stage, with either decrease (pre-MBT1) or a continued increase after 3.5 hpf (pre-MBT2). (D) Zygotic supercluster consisting of genes activated at 3.5 hpf (MBT) and 5.3 hpf (post-MBT), or maternal–zygotic cluster genes that showed stable accumulation of transcripts during pre-MBT and with a sudden increase at MBT and post-MBT.


