
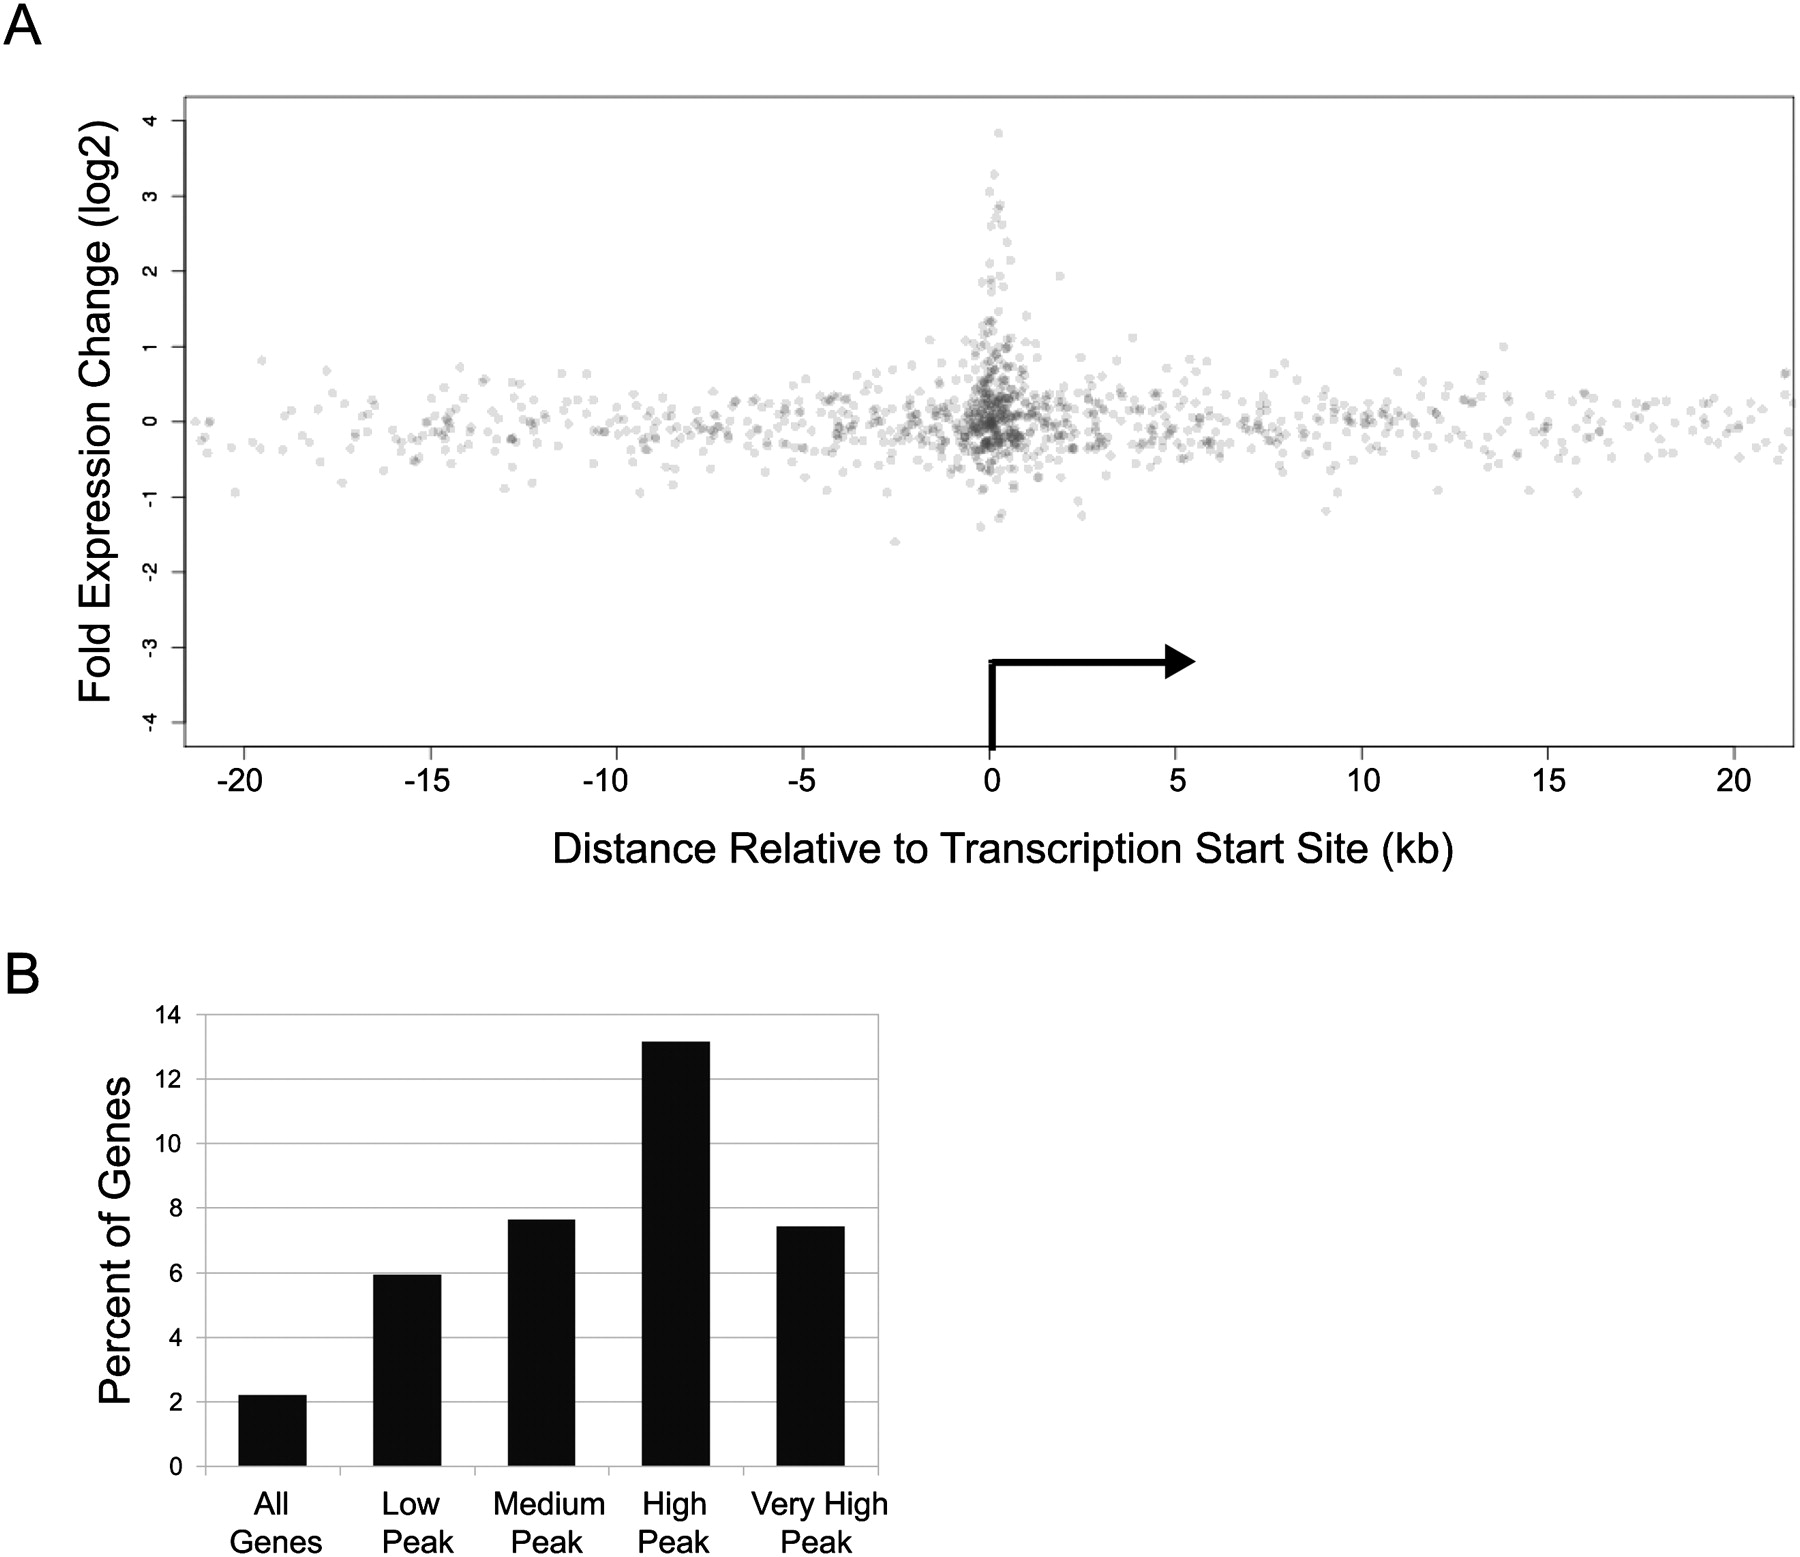
Figure 6.
Factors influencing the probability of gene repression by REST. (A) For every gene, the unique closest REST peak was identified and plotted, such that the x-axis indicates the relative position of the peak with respect to the TSS, and the y-axis indicates the log2 fold change in gene expression in response to shREST. Height ranges, as reported by the SISSRS program, were defined as the following: Low (peak height 0–20), Medium (20–40), High (40–60), Very High (60+). (B) For all genes having a REST peak within 10 kb of their TSS, the proportion significantly increasing (P < 0.01, corrected) in response to shREST are shown.


