
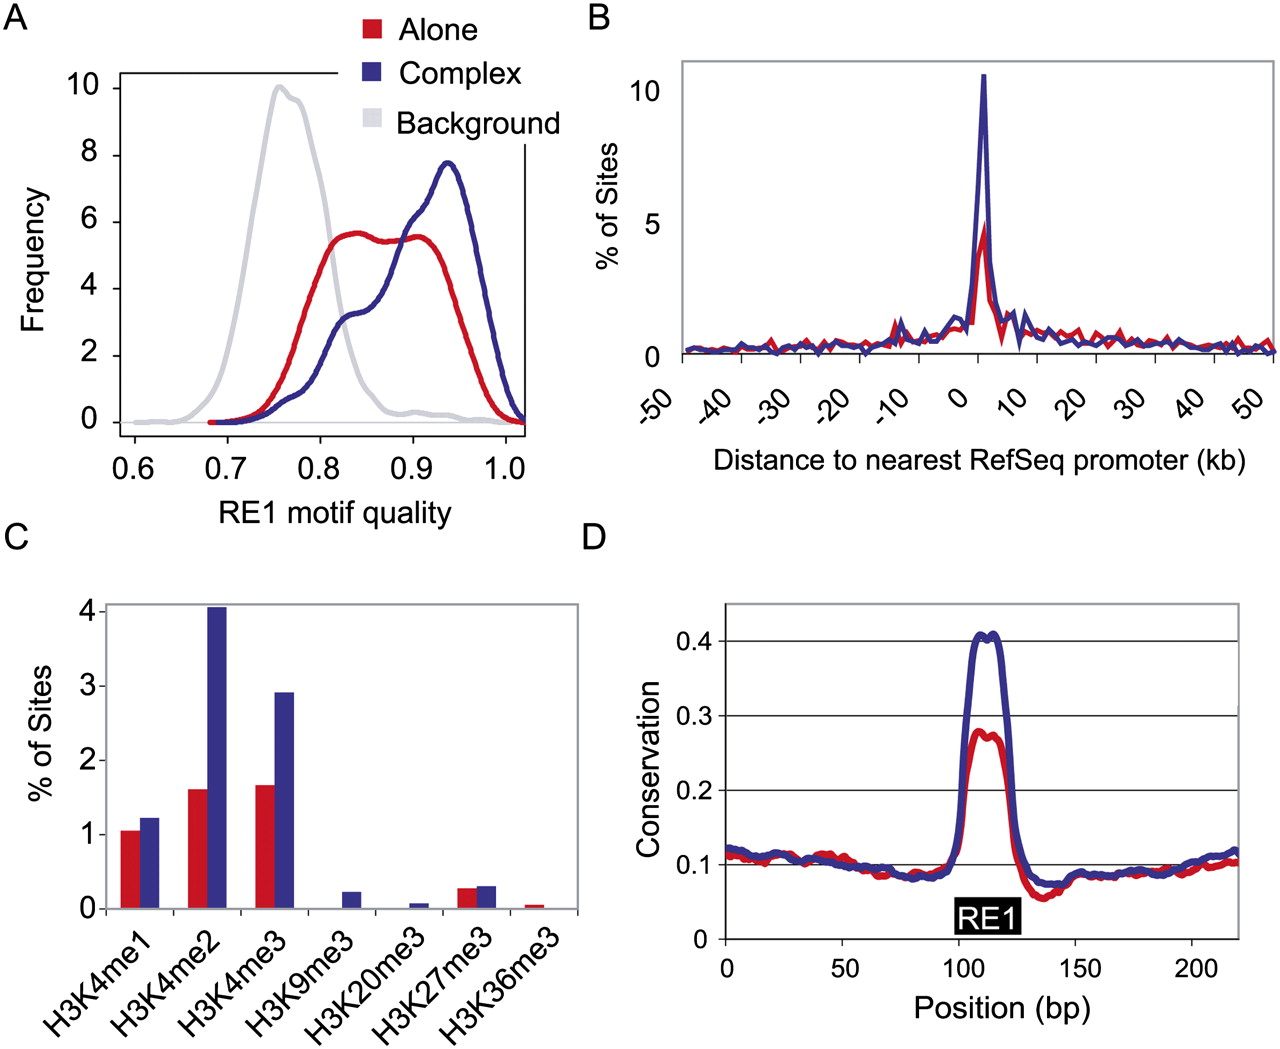
Comparing REST Alone and Complex binding sites. (A) REST Alone sites have weaker RE1 motifs compared with Complex. We scanned all peaks for RE1 motifs. Motifs were scored based on their similarity to the ideal, where 1 indicates a perfect match. For every REST Alone site, we extracted an equally sized genomic region immediately adjacent to it, and scanned these for RE1s in the same way (“Background”). (B) Proximity of REST sites to gene TSS. The distance of all REST binding sites with respect to the nearest RefSeq gene TSS was calculated. Negative values indicate upstream of TSS. (C) REST binding sites were overlapped with the coordinates of the various histone modifications indicated (Mikkelsen et al. 2007). (D) Evolutionary conservation of the RE1 motif was greater for Complex REST sites than Alone sites. Degree of conservation is displayed over 200 bp of genomic sequence spanning RE1 sites.


