
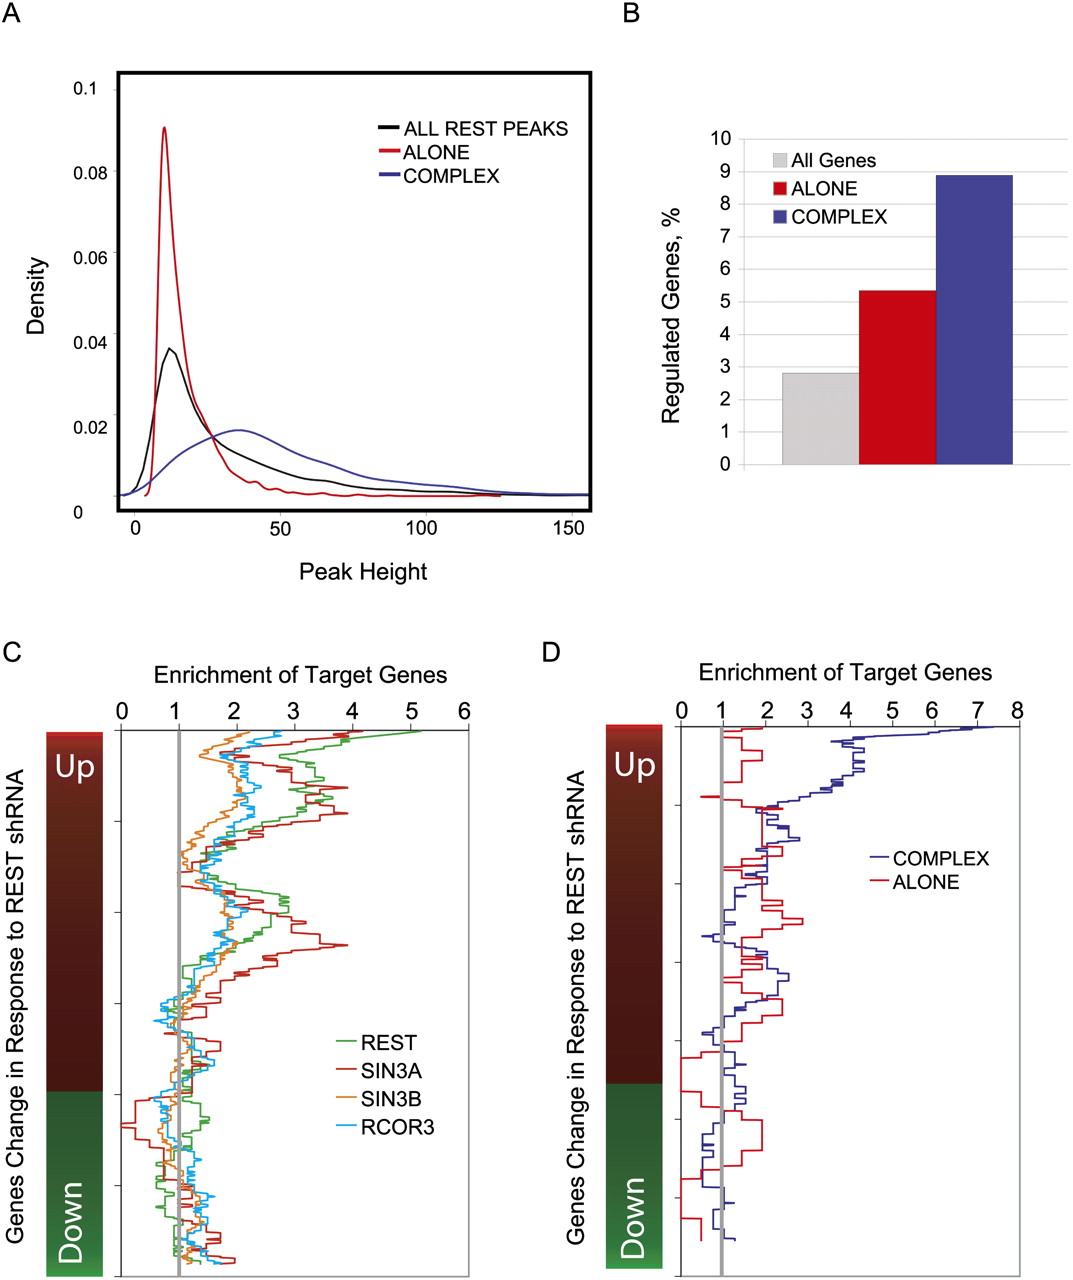
Contribution of genomic binding sites to direct gene regulation. (A) Distributions of reported peak heights for all REST peaks (black line), REST Complex peaks (blue), and REST Alone peaks (red). (B) The percentage of genes significantly regulated (P < 0.01) in response to shREST treatment are shown for all genes on the microarray (gray), all genes having a REST Alone peak within 10 kb of their TSS (red), and all genes having a REST Complex peak within 10 kb of their TSS (blue). ChIP-seq loci were combined with REST-shRNA microarray gene expression to estimate direct gene regulation. Genes were defined as “bound” if a ChIP-seq peak was detected in a 40-kb window centered on the annotated transcription start site. All genes changing significantly (up or down) in response to REST shRNA were ranked based on their fold change. A sliding window was moved down the ranked gene list, and the number of bound genes was calculated and expressed as fold enrichment over background. Background was defined to be the average density of bound genes, for all genes in the genome. (C) The density of genes bound by REST and cofactors is shown. (D) REST ChIP-seq data was divided into REST Alone and REST Complex categories. In order to avoid any bias of spurious noise sites toward the former, we only included those peaks containing an RE1 motif.


