
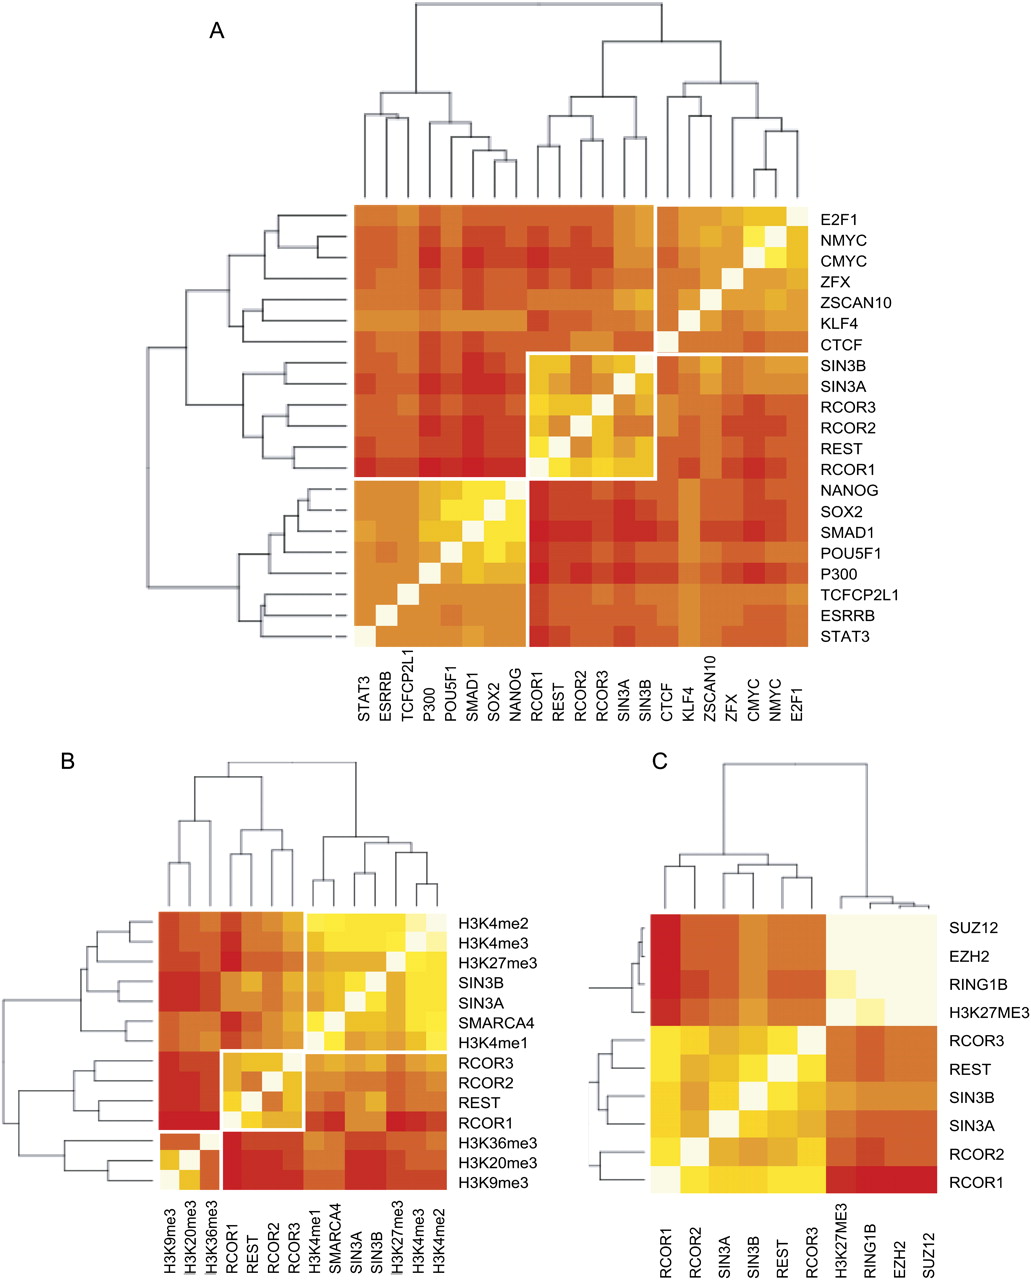
Figure 3.
Discerning regulatory complexes by clustering. The heatmap represents the degree of overlap of each ChIP-seq set with every other. Color (yellow as strongest and red as weakest) reflects the intensity of overlap. The data were clustered by Pearson correlation. REST and cofactors were clustered with coordinates of (A) 13 pluripotency-associated TF, and P300 (Chen et al. 2008), (B) various covalent histone modifications (Mikkelsen et al. 2007), and (C) the Polycomb silencing complex, with associated repressive histone modifications (Ku et al. 2008).


