
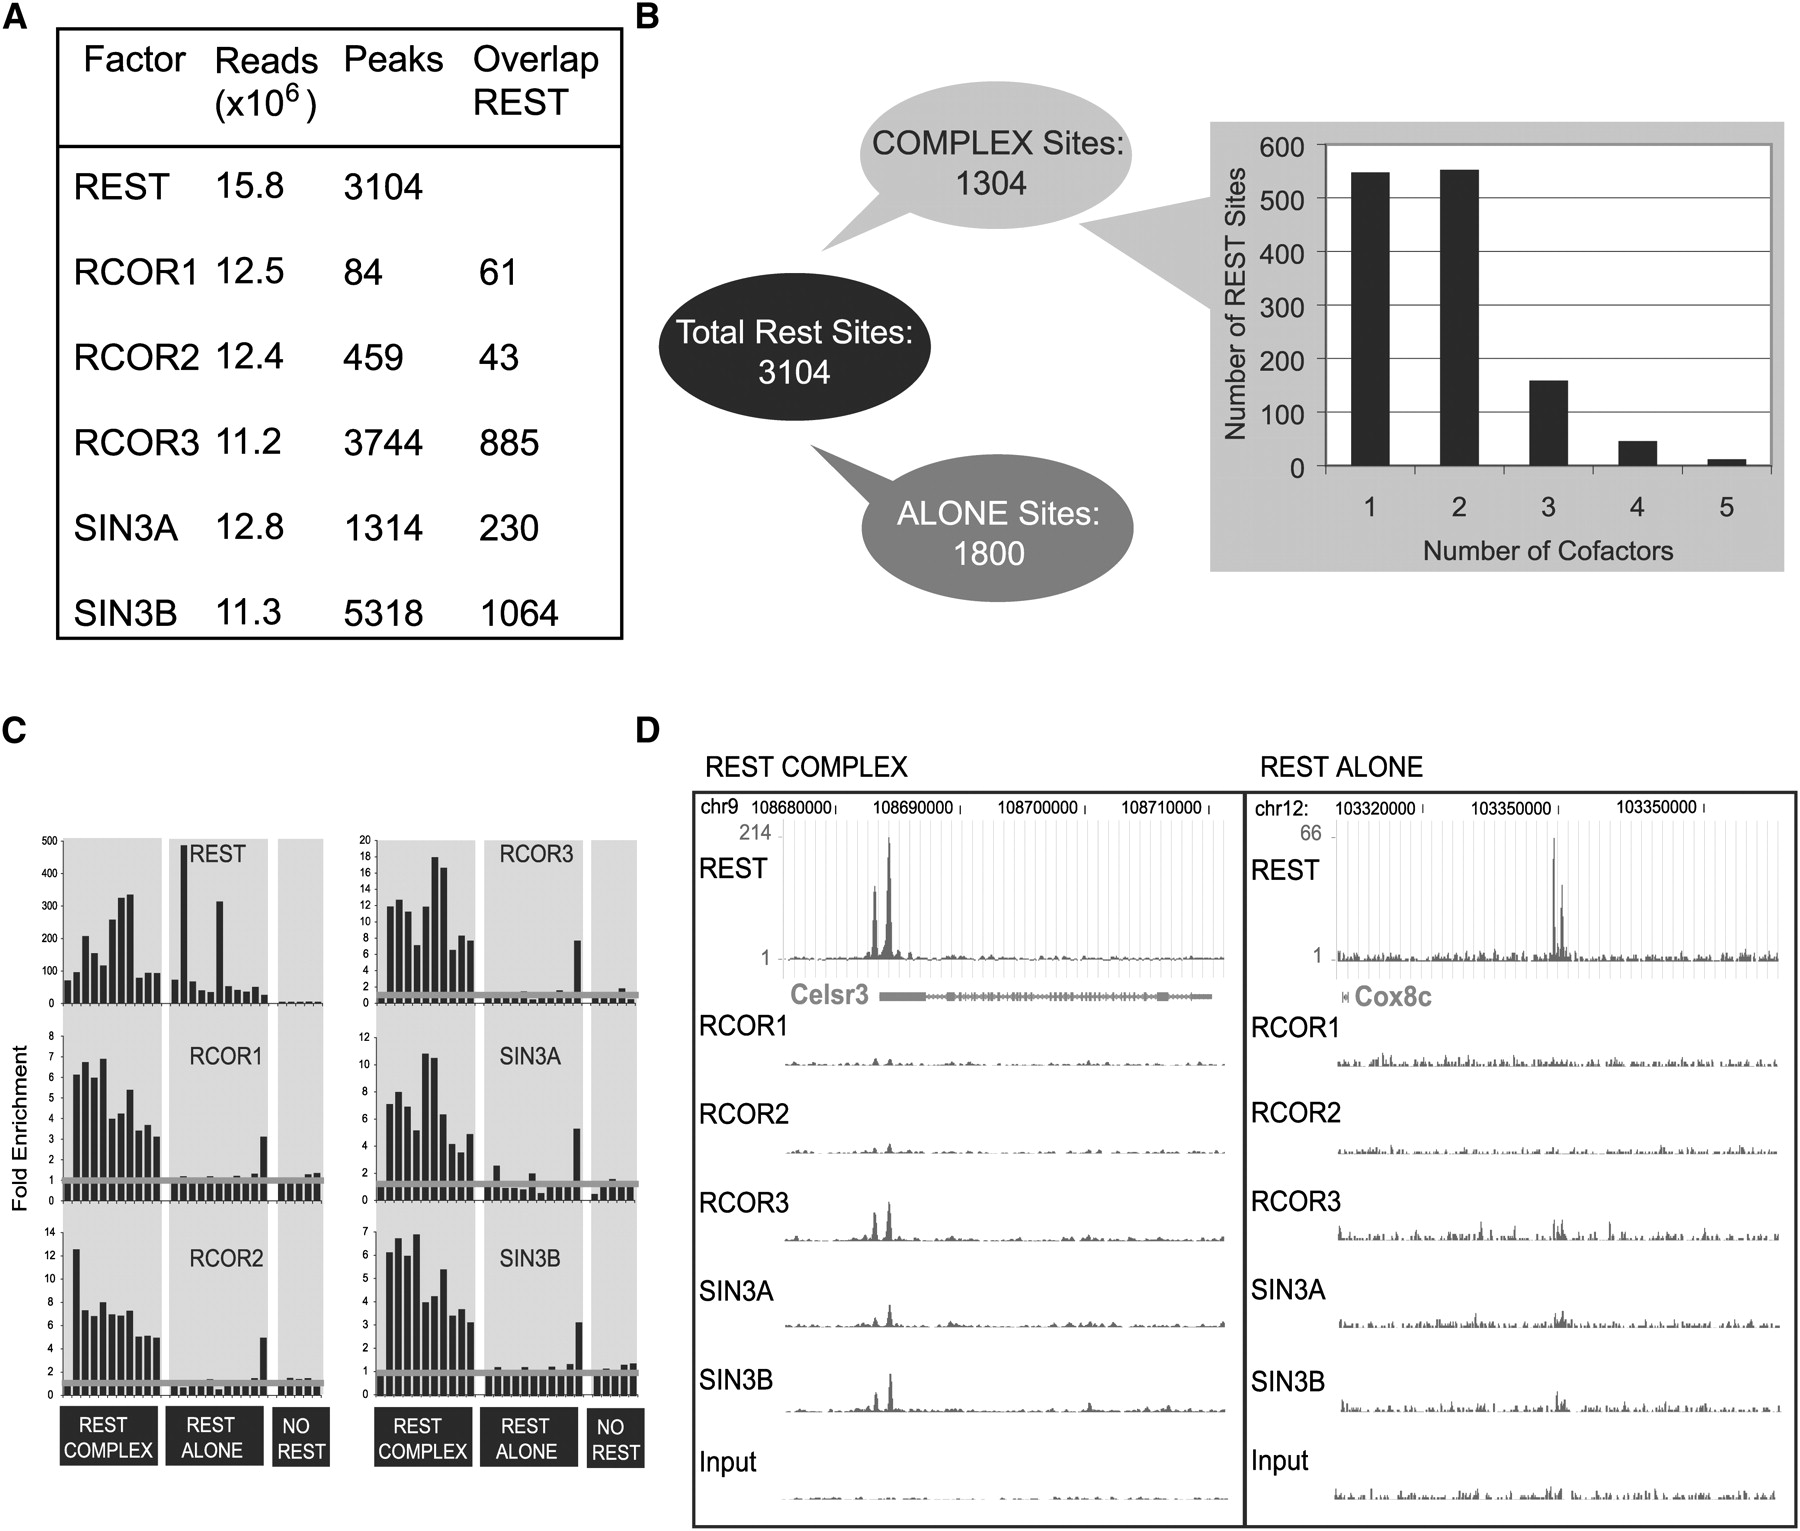
Genomic mapping of cofactor recruitment in ESC by ChIP-seq. (A) ChIP-seq statistics for REST and five cofactors. “Reads” indicates the number of millions of uniquely mappable sequence reads. “Peaks” of ChIP-seq reads, indicative of genomic binding loci, were identified using the SISSRs program, as described in Methods. The number of cofactor peaks falling within 100 bp of a REST peak is also indicated. (B) Breakdown of REST binding sites, based on cofactor recruitment. REST “Complex” sites are defined as those overlapping at least one of the five cofactors, and “Alone” sites bind only REST. (C) Conventional ChIP–qPCR was used to validate REST Alone and Complex sites. The enrichment of cofactors was measured for randomly selected REST binding sites from the REST Complex (five Factors) and the REST Alone sets. Enrichment was also measured at five control loci with no evidence for recruitment of REST. The horizontal gray line denotes background. ChIP was carried out using anti-V5 antibody, with the exception of REST and SIN3A, where endogenous protein was measured. (D) Examples of REST Complex (left) and REST Alone (right) loci. The green bars indicate the density of ChIP-seq reads across the genome. Exons of the proximal genes (Celsr3 and Cox8c) are shown as blue boxes.


