
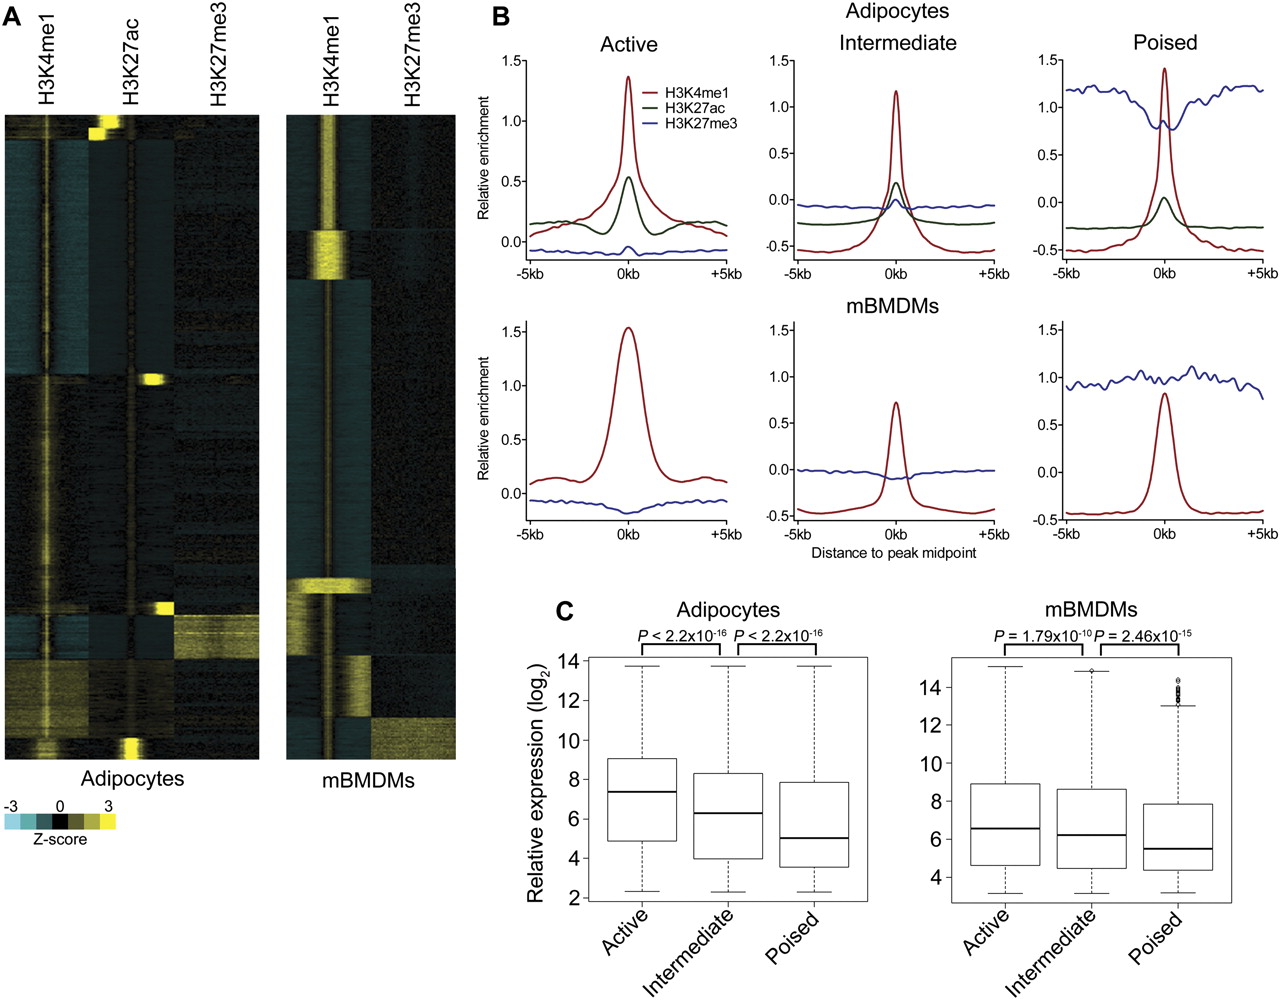
Figure 7.
Identification of multiple enhancer classes in terminally differentiated cells. (A) Heatmaps demonstrating the presence of active, intermediate, and poised enhancer classes in adipocytes and mBMDMs. Each window represents ±5 kb of the H3K4me1/H3K27ac peak midpoint in adipocytes or the H3K4me1 peak midpoint in mBMDMs. (B) Aggregate plots of enhancer-associated histone modifications for each adipocyte and mBMDM enhancer class. (C) Average expression of genes associated with each enhancer class in adipocytes and mBMDMs. P-values were calculated by the Wilcoxon rank-sum test.


