
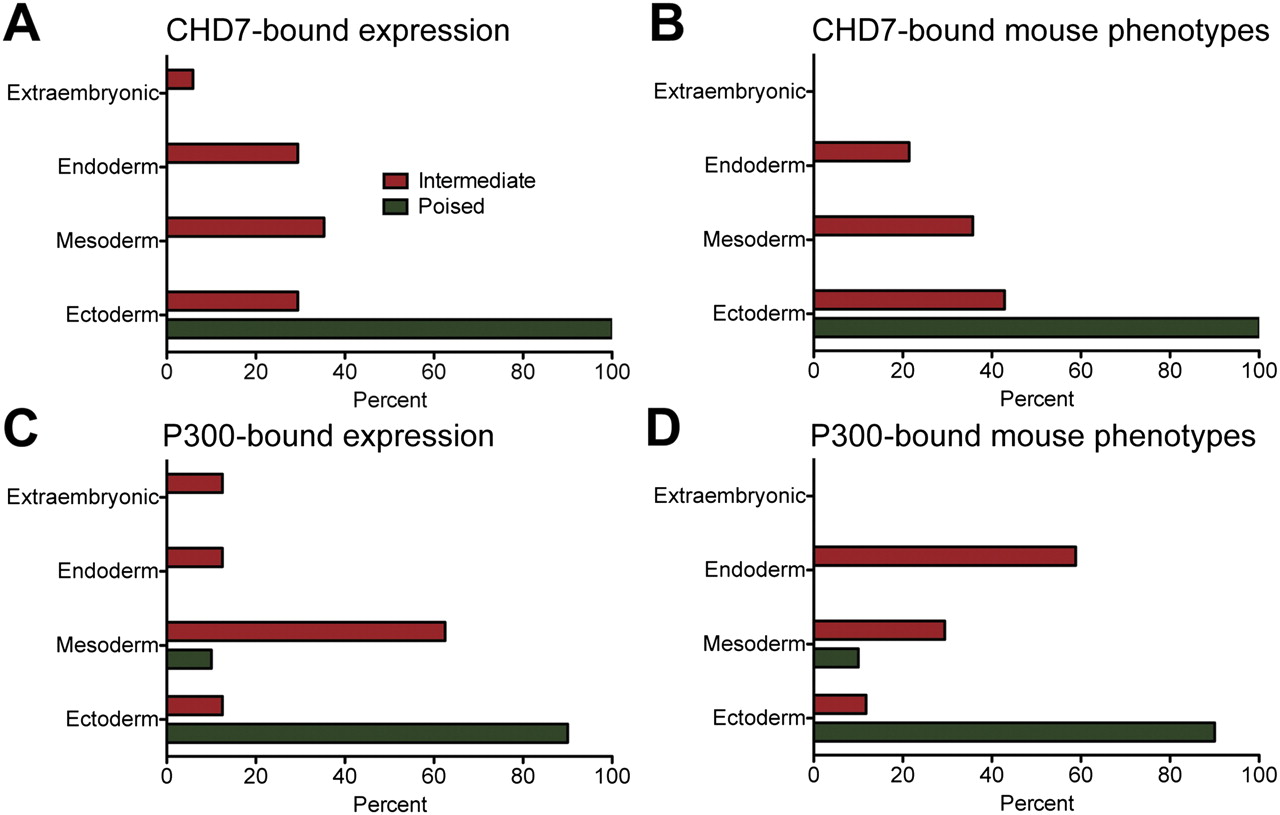
Expression and phenotypic analysis of enhancer-associated genes, correlated with germ layer. The spatiotemporal expression patterns of genes associated with each enhancer class in the developing mouse embryo were determined using GREAT. The germ layer origin of the tissue linked to each annotation was then determined (see Methods). Shown is the percentage of expression annotation terms corresponding to each germ layer, as well as extra-embryonic tissue, for CHD7-bound (A) and P300-bound (C) enhancers. Mouse phenotypes resulting from the mutation of genes associated with each enhancer class were also determined using GREAT. Shown is the percentage of mouse phenotypes, classified by the germ layer of origin of the affected tissue, for CHD7-bound (B) and P300-bound (D) enhancers.


