
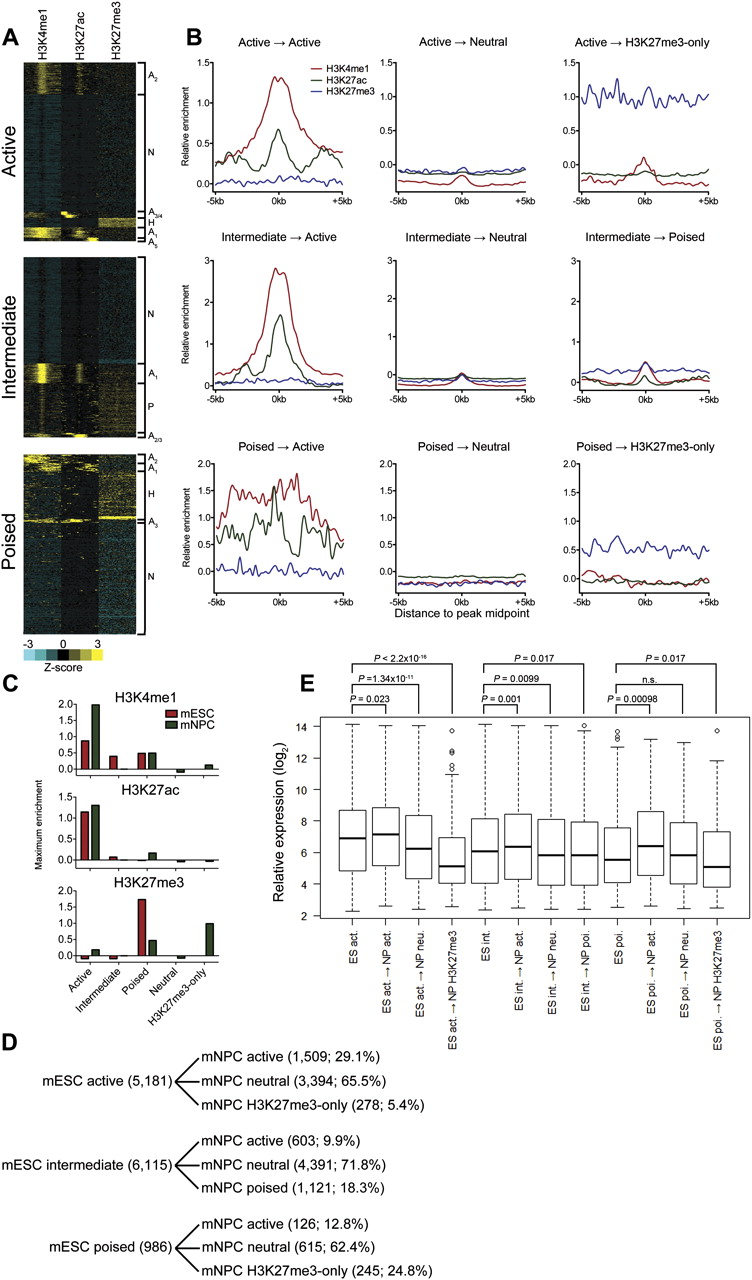
Fate of mESC enhancer classes upon differentiation into neural precursor cells. (A) Heatmaps of enhancer-associated histone modifications in mNPCs defined by active (top), intermediate (middle), and poised (bottom) classes in mESCs. Each window represents ±5 kb of the CHD7 peak midpoint in mESCs. H3K9me3 was also present at poised enhancers derived from the intermediate class (data not shown). (B) Aggregate plots of enhancer-associated histone modifications for each mNPC enhancer class derived from each mESC class. (C) Bar plot of the average maximum signal for each histone modification in each mESC and mNPC enhancer class. The plot indicates that poised enhancers derived from intermediate-class enhancers contain significant levels of both H3K4me1 and H3K27me3, which is less apparent in the aggregate plot in B. (D) Summary of chromatin states achieved upon neural differentiation. The number and percentage of each enhancer state achieved are indicated. (E) Boxplot of expression levels of genes associated with each mNPC enhancer class compared to the average expression of genes in the mESC class from which they were derived. P-values were calculated by the Wilcoxon rank-sum test.


