
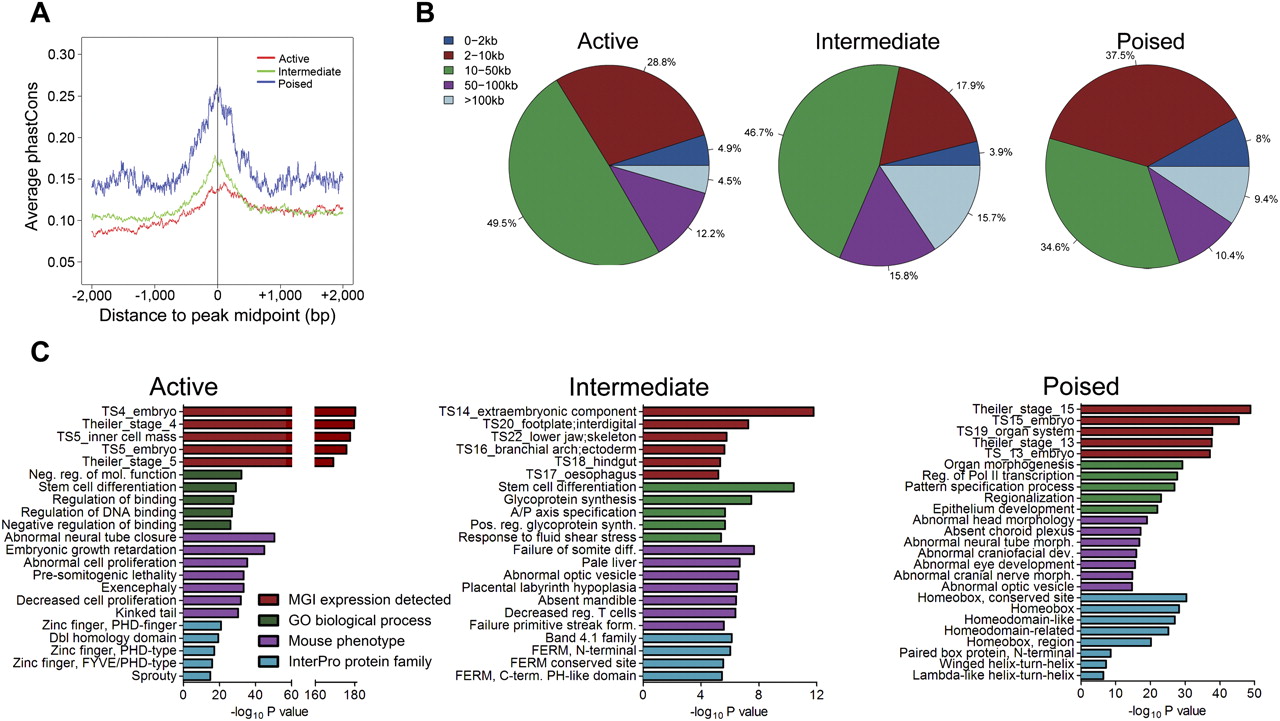
Figure 4.
Distinguishing features of enhancer subclasses. (A) Average phastCons plot for each enhancer class in a 4-kb window centered on the CHD7 peak midpoint. (B) Distribution of enhancers in each class relative to known transcription start sites. (C) Results of functional annotation of each enhancer class using GREAT. The −log10 of the binomial test P-value is reported.


