
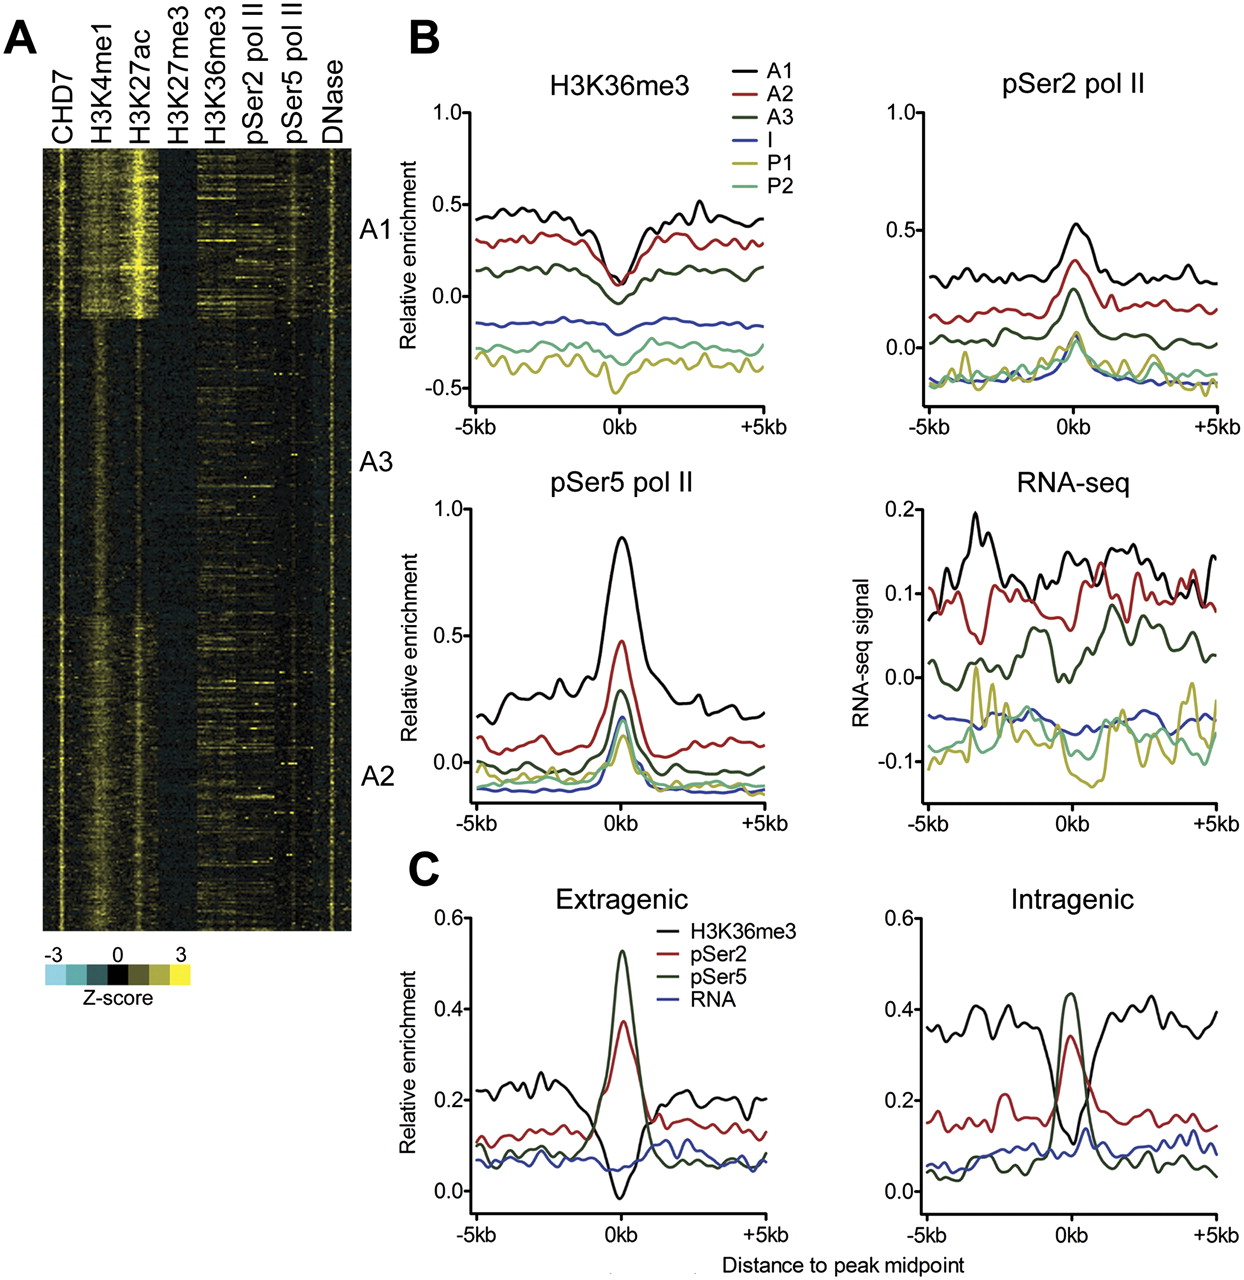
Figure 2.
Sub-classification of active enhancers. (A) Heatmap showing levels of CHD7, histone modifications, pSer2/5 pol II, and DNase-seq signals for each active enhancer cluster. Each window represents signal ±5 kb of the CHD7 peak midpoint. (B) Aggregate plots of H3K36me3, pSer2 pol II, pSer5 pol II, and RNA-seq signal at each enhancer subclass centered on the CHD7 peak midpoint. (C) Aggregate plots showing H3K36me3, pSer2 pol II, pSer5 pol II, and RNA-seq signal at CHD7-centered active enhancers located in extragenic and intragenic regions.


