
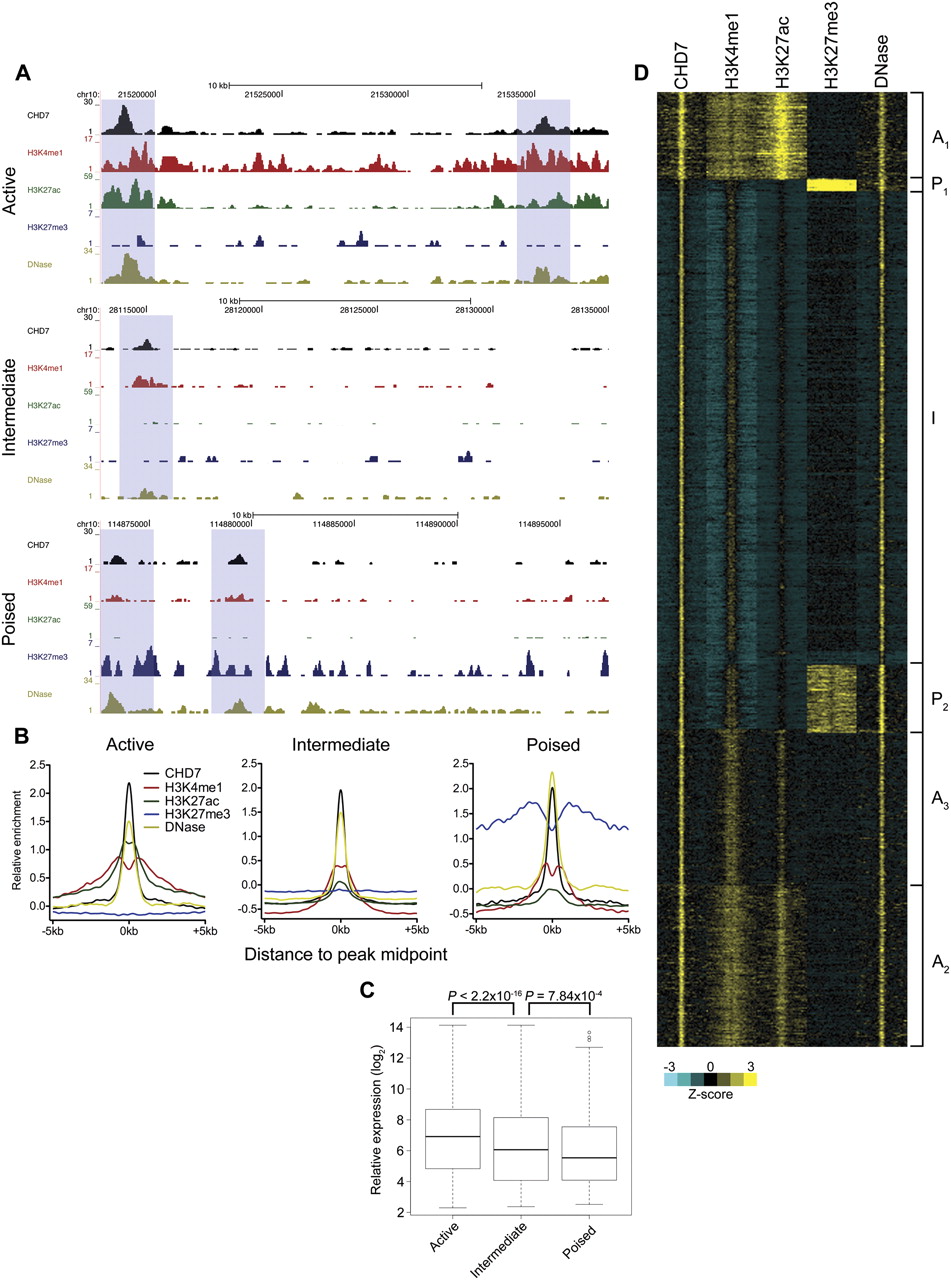
Identification of multiple enhancer classes. (A) Example ChIP-seq profiles of each enhancer class in mESCs. Data were visualized using the UCSC Genome Browser. Putative active, intermediate, and poised enhancers are highlighted in blue boxes. (B) Aggregate plots of CHD7, H3K4me1, H3K27ac, H3K27me3, and DNase hypersensitivity signal centered on the CHD7 peak midpoint. (C) Boxplot of expression levels of genes associated with each enhancer class. P-values were calculated by the Wilcoxon rank-sum test. (D) Heatmap of CHD7-bound enhancers generated by k-means cluster analysis. Each window represents signal ±5 kb of the CHD7 peak midpoint. Active clusters are designated A1-3, the intermediate cluster is designated I, and the poised clusters are designated P1-2.


