
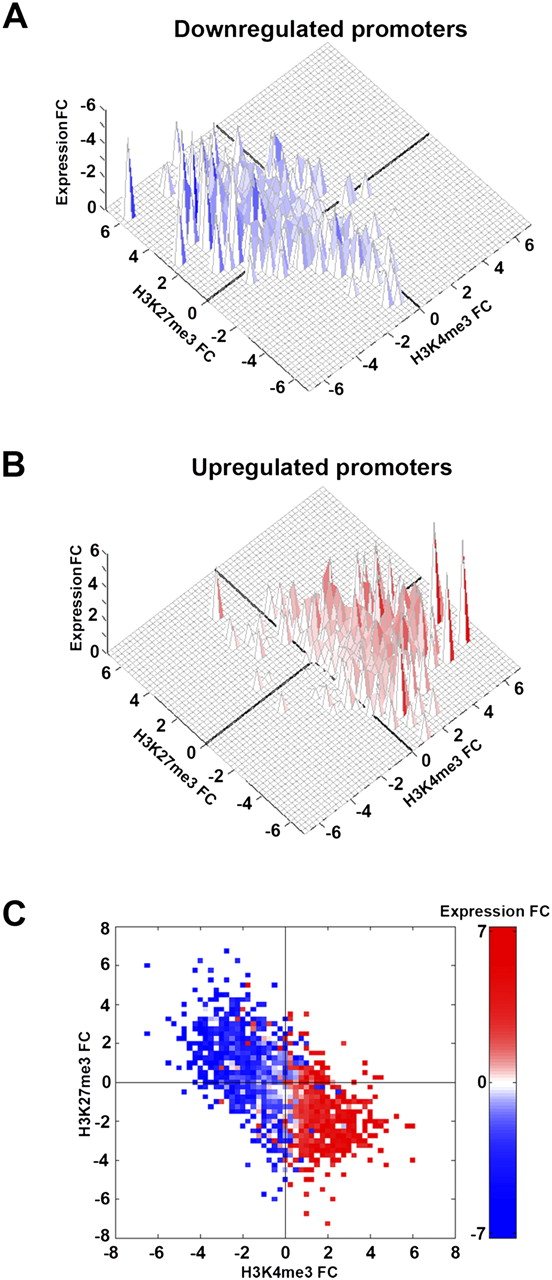
Three-dimensional graphical visualization of H3K4me3 and H3K27me3 enrichments near promoters and expression of corresponding transcripts. For this analysis, we selected the promoters that correspond to transcripts whose expression were either up- or down-regulated during development by at least twofold between any two developmental stages and were also simultaneously marked by H3K4me3 and H3K27me3. The 3D plots show the relationship between transcript expression and relative enrichment (fold change: FC) of both marks on the down-regulated (in blue, A) and up-regulated (in red, B) promoters of genes that are differentially expressed during cerebellar development. The x, y, and z-axis represent the log2 fold change (FC) in H3K4me3, H3K27me3, and expression, respectively, between stages, with scale being negative for down-regulated promoters and positive for up-regulated promoters. (C) Heatmap shows the relationship of changes in transcript expression with the trimethylation of H3K4 and H3K27 on respective promoters of developmentally regulated transcripts shown above in A and B.


