
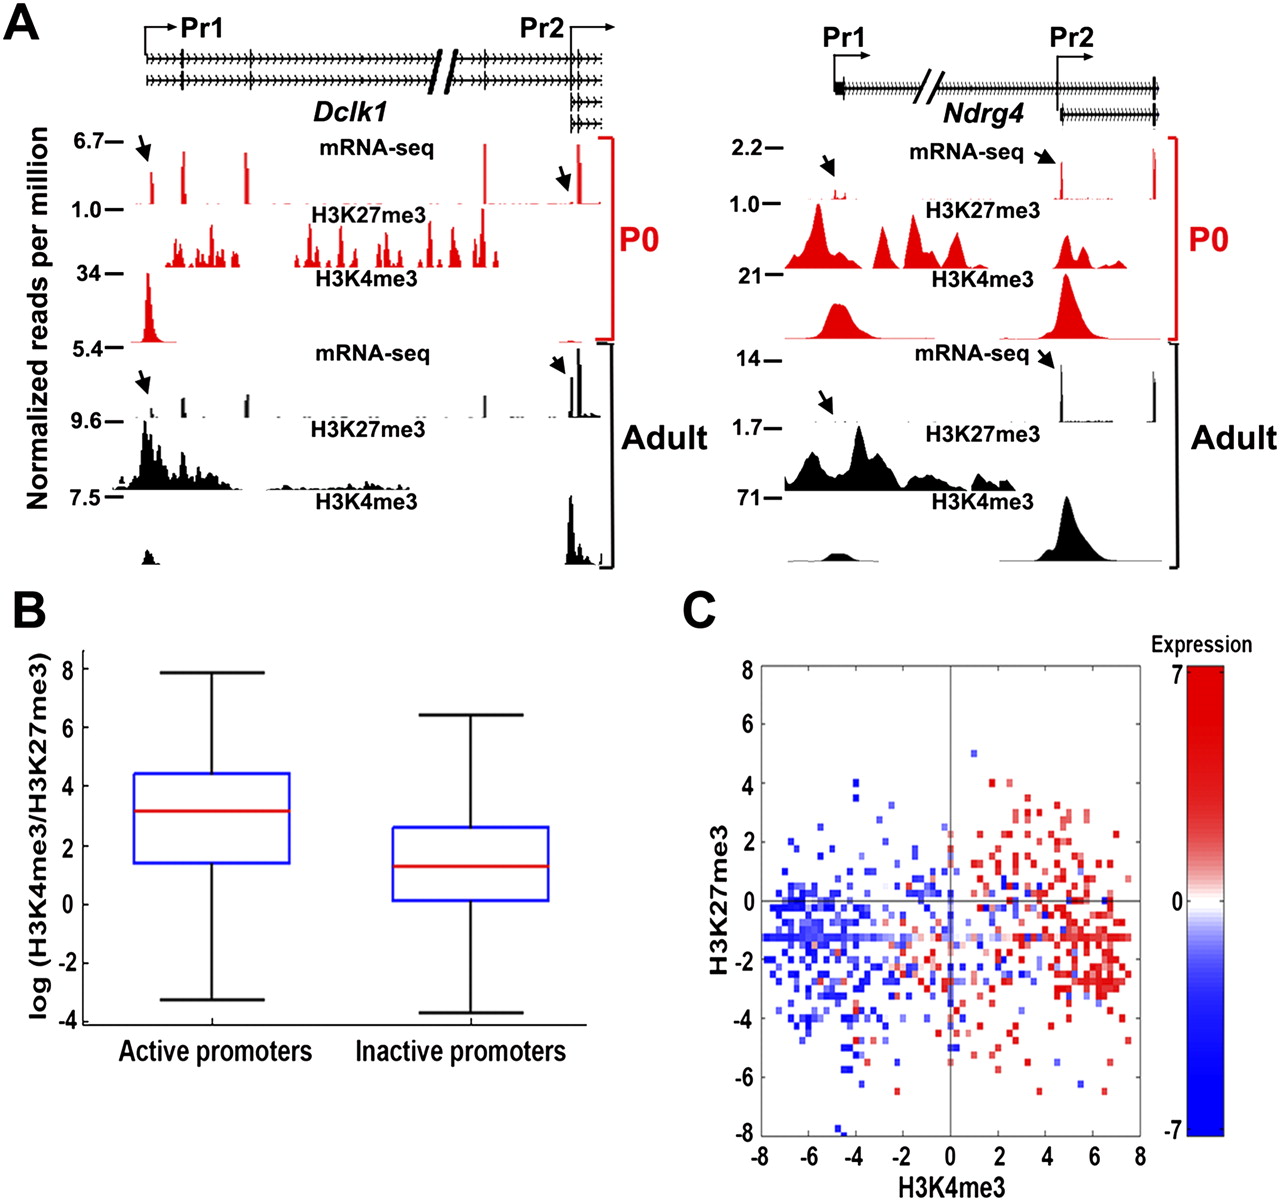
Distinct histone modification profile of active and inactive promoters and their role in alternative promoter selection during development. (A) Wiggle profiles of mRNA expression and H3K4me3, H3K27me3 modifications on the alternative promoters of Dclk1 and Ndrg4 in P0 (red) and adult (black) cerebella. The arrows point to either the expression of AFE or the enrichment of H3K4me3 and H3K27me3 at the alternative promoters. The loss of transcript expression from promoter (Pr) 1 for Dclk1and Ndgr4 in adult cerebellum is marked by reduced/loss of H3K4me3 and highly enriched H3K27me3. In contrast, the increase in expression from Pr2 parallels high H3K4me3 and loss of H3K27me3. (B) Box plot shows the distribution of relative enrichment of H3K4me3 over H3K27me3 on the active and inactive promoters marked by both marks in P0. (C) Heat map shows the distribution of relative H3K4me3 and H3K27me3 enrichment in log2 scale on the alternative promoters of two promoter genes, where the expression of alternative promoters differs at least twofold. Expression is represented as log2 fold change between alternative promoters of a gene. Red means up-regulation and blue represents down-regulation of expression.


