
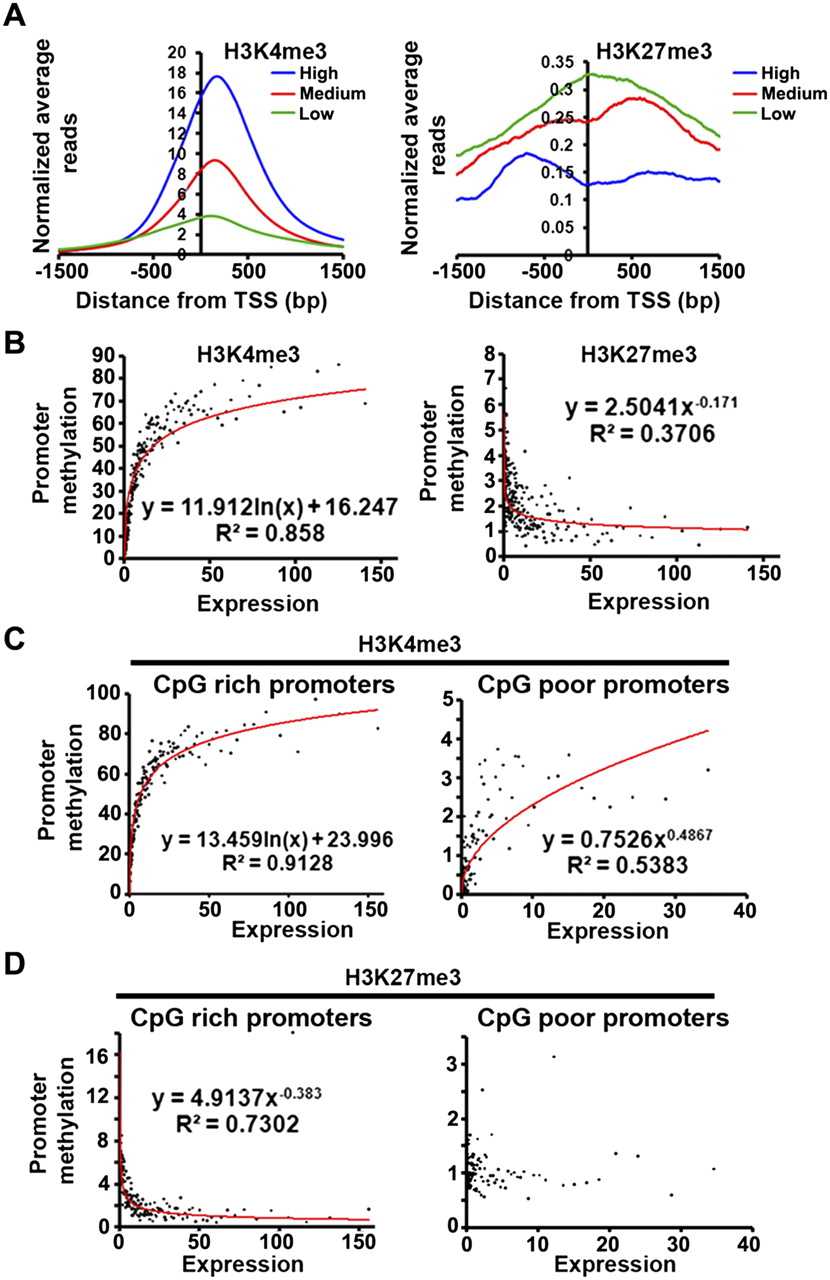
Correlation of H3K4me3 and H3K27me3 enrichment at the promoter with the expression of corresponding transcripts. (A) The active promoters of P0 were divided into three groups based on the expression of their transcripts into low, medium, and high expressed promoters, and the global profile of H3K4me3 and H3K27me3 were plotted for each group around the TSS. (B) In order to find the mathematical relation between H3K4me3 or H3K27me3 at the promoters with transcript expression, promoters were clustered into groups of 50 promoters based on their transcript expression. The figure shows the scatter plot and the best fitted curve for the average level of H3K4 or K27 trimethylation as a function of average cluster expression. (C,D) Role of H3K4me3 and H3K27me3 modification on transcript expression driven by CpG-rich and CpG-poor promoters. The promoters analyzed in B were first divided into CpG-rich and CpG-poor categories, and clusters of 25 promoters were formed in each category based on the expression of the corresponding transcripts. Next, the average levels of H3K4me3 (C) and H3K27me3 (D) in each cluster were plotted as a function of average cluster expression as in B.


