
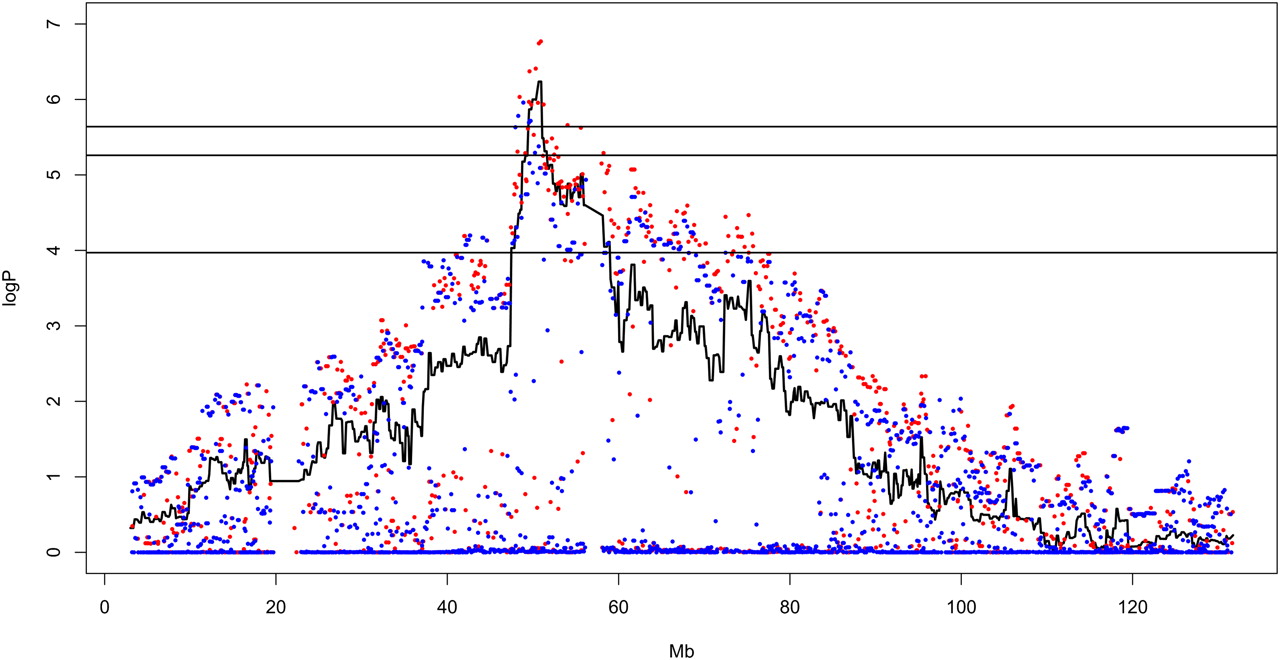
Merge analysis of sequence variants around the QTL Asprl1 on chr 8, for susceptibility to Aspergillus fumigatus infection in the CC. The x-axis is genome location; the y-axis is the logP of the test of association between locus and survival time. The continuous black line is the genome scan in Figure 4. The blue and red dots are the results of merge analysis tests of sequence variants segregating in the eight founders of the CC. For clarity, the great majority of variants with merge logP < 1 are not shown. Biallelic SNPs are in blue; variants with more than two alleles (caused when alleles are unknown in one or more founders, which are then treated as private alleles) are red. Image is taken from the genome scan viewer (http://mus.well.ox.ac.uk/gscan_flot/).


