
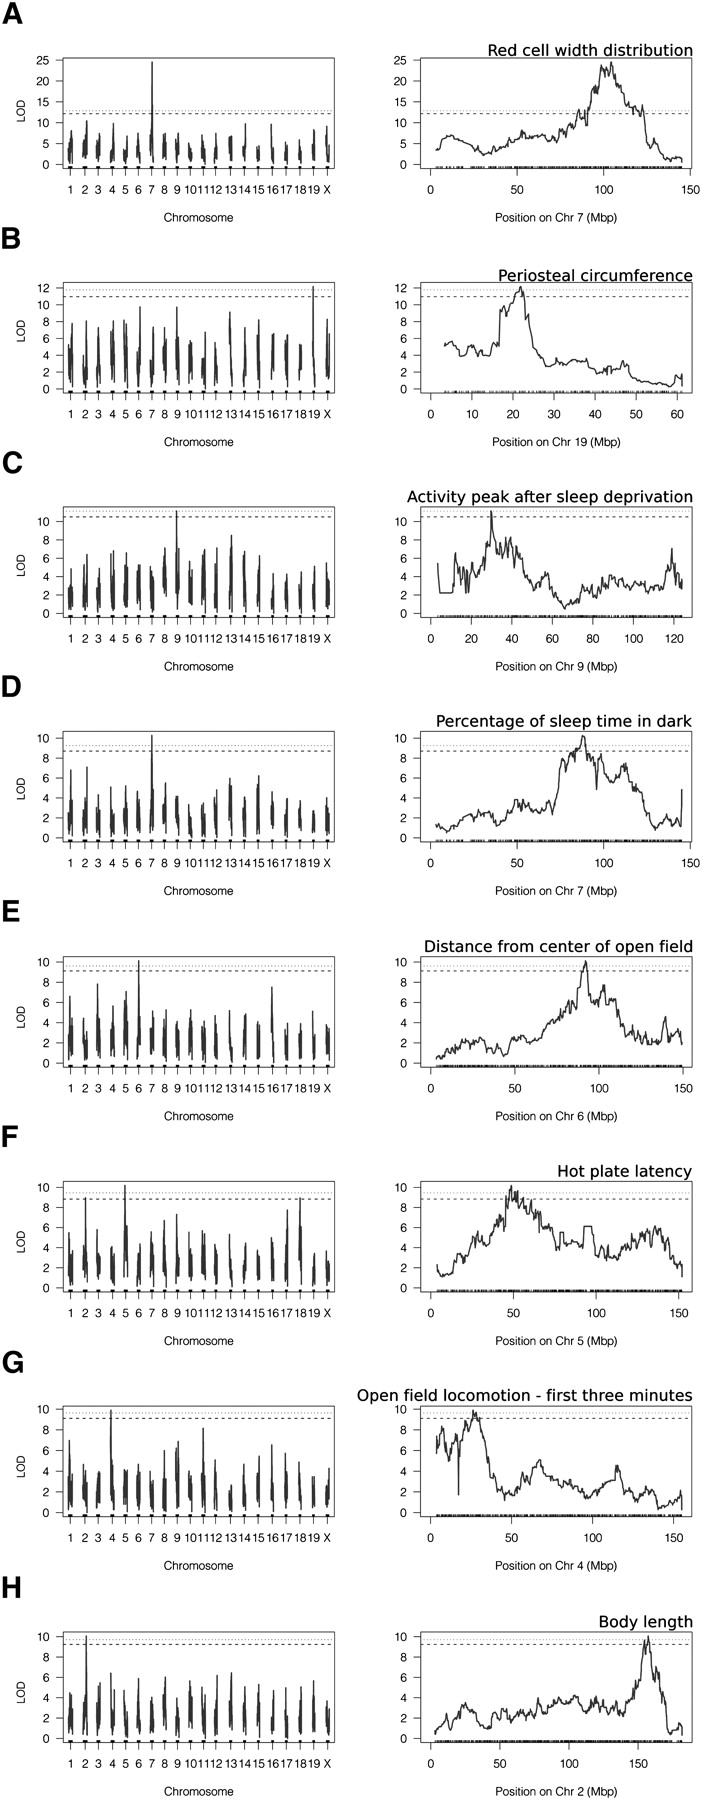
Figure 8.
Significant genome-wide QTLs. (A) Red blood cell width distribution. (B) Periosteal circumference. (C) Peak activity time in hours from dark onset after sleep deprivation. (D) Average percentage of sleep time over dark cycles for all baseline days. (E) Average minimum distance of the center of the mouse from the absolute center of the open field (cm). (F) Thermal nociception. (G) Open field locomotion in the first 3 min. (H) Body length. Horizontal lines indicate genome-wide significance thresholds based on 1000 permutations. Dotted lines are genome-wide significant thresholds at p ≤ 0.05; dashed lines indicate genome-wide suggestive thresholds at p ≤ 0.10.


