
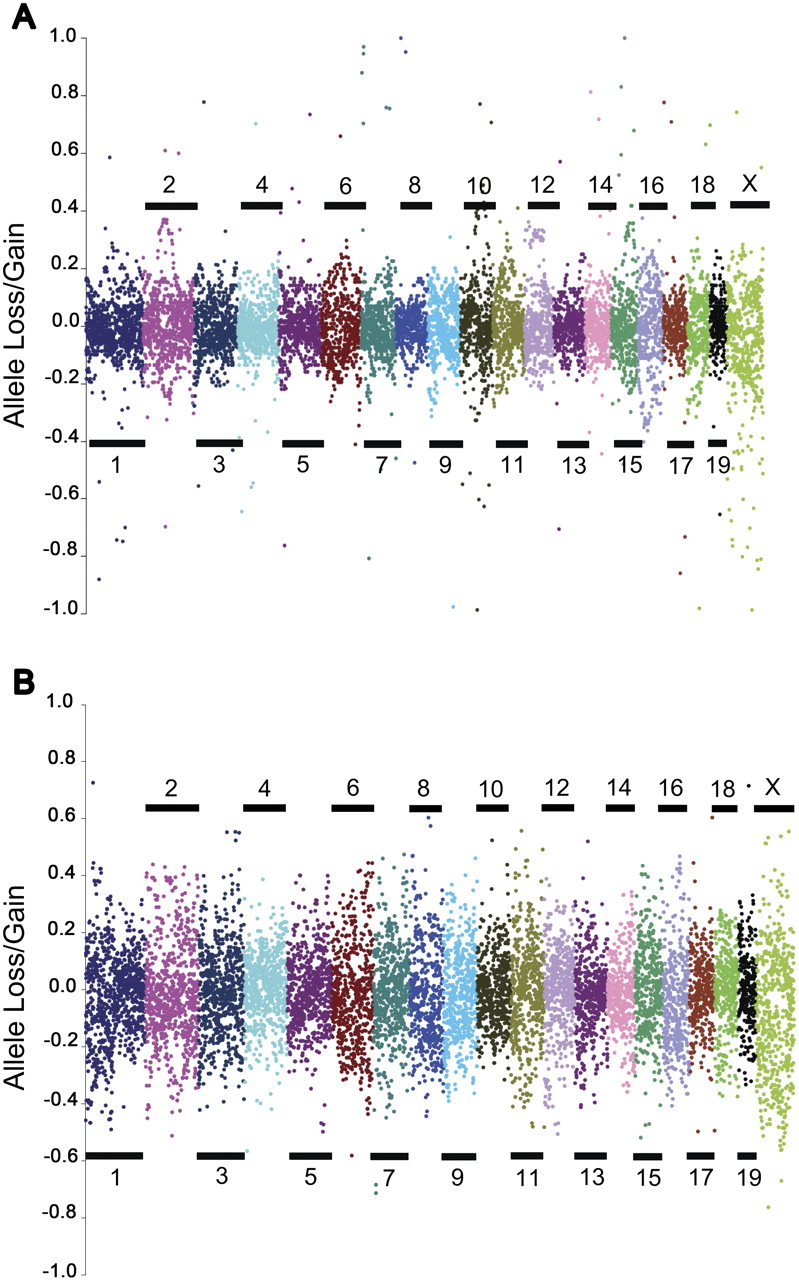
Figure 6.
Assessment of allele loss during inbreeding. Comparison of the percent allele loss between (A) progenitors (G0) and final outcross generation (G2:F1). (B) G2:F1 and the seventh inbreeding generation (G2:F7). Positive values indicate SNPs with an increase in minor allele frequency, while negative values indicate a decrease (allele loss) in minor allele frequency. The y-axis indicates the percent change from G0 allele frequency.


