
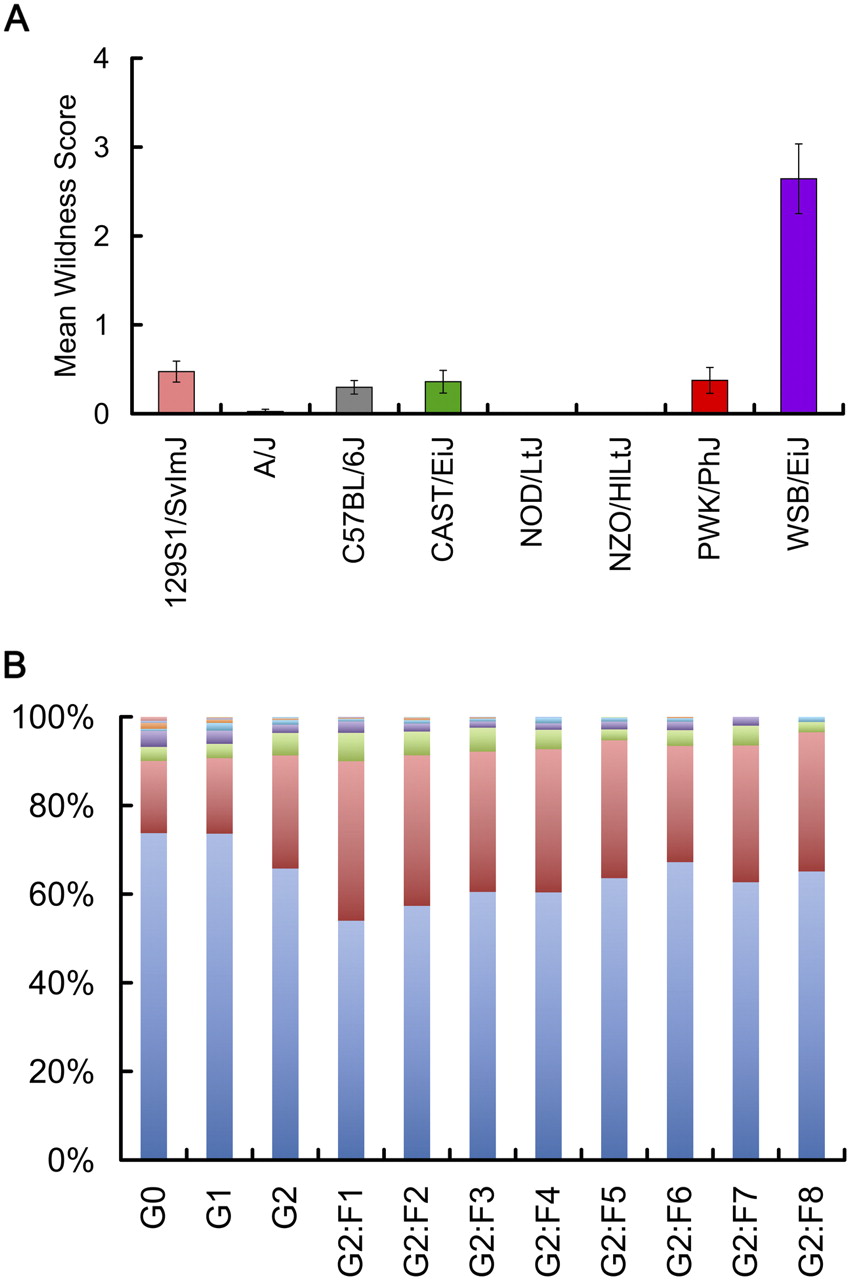
Wildness variation among CC progenitors, outcrossed (G1 and G2) and inbreeding generations (G2:F1 to G2:F8). (A) Mean wildness scores among CC progenitors. Among the progenitors, behavioral wildness resembles a discrete trait with high wildness in WSB/EiJ and low wildness in the other lines. (B) Proportion of mice in CC generations with wildness scores of 1 (blue), 2 (red), and >2 (other colors). Among the outcrossed generations, wildness scores increase, and among the inbreeding generations, a greater proportion of intermediate values is observed. In general, while more mice have scores >1 in the CC lines, fewer extreme high scores were observed, suggesting a restoration of continuous variation of this phenotype.


