
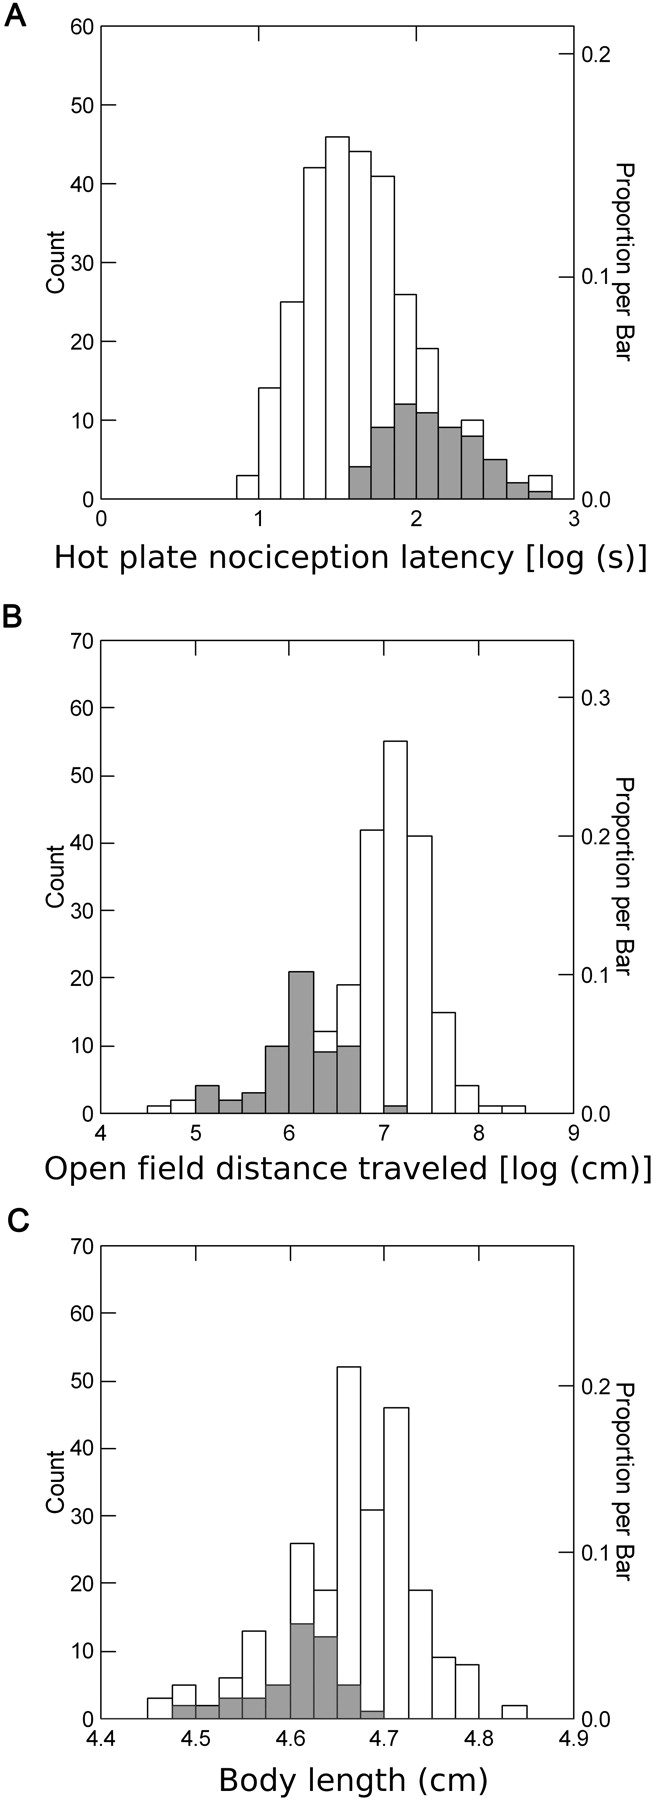
Figure 2.
Comparison of phenotypic distributions among the CC and BXD mice. Shaded bars represent the phenotypic distribution of the BXD population. (A) Distribution of thermal nociception across the CC and BXD populations. (B) Distribution of distance traveled in the open field across the CC (during the first 3 min) and BXD populations (during the first 5 min). (C) Distribution of body lengths across the CC and BXD populations. Note that in all the three examples the phenotypic range of the BXD population is contained within one side of the distribution of CC phenotypes.


