
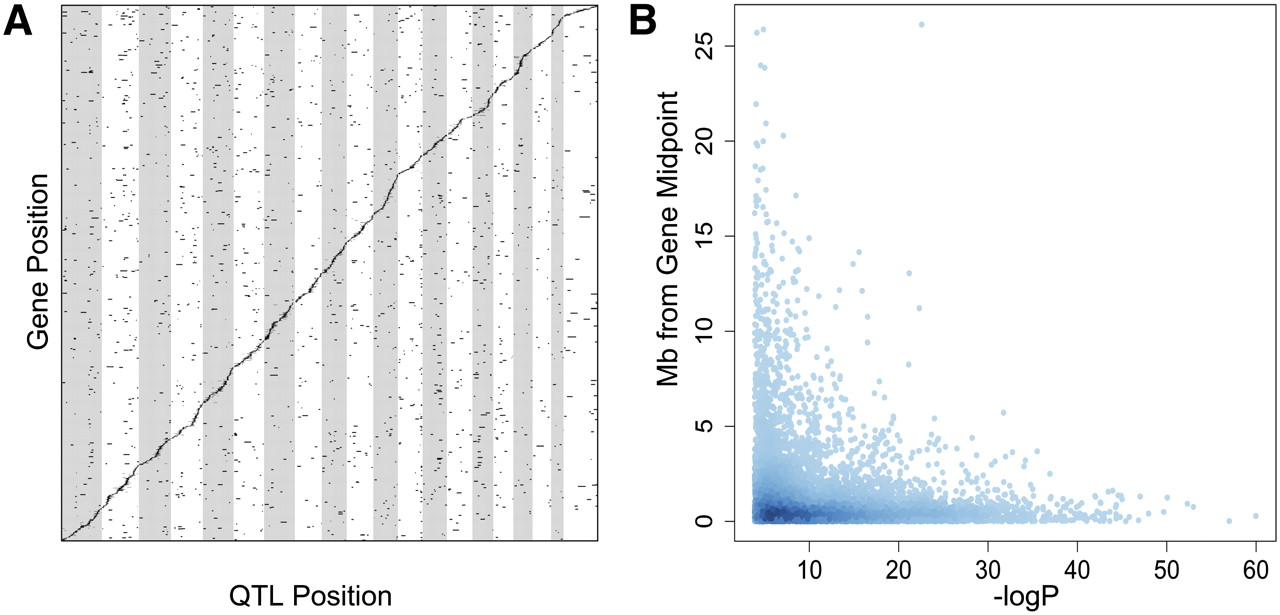
Figure 5.
Expression QTL from liver. (A) A total of 7235 eQTLs were detected for 6327 genes. Genes, arranged in order of genomic position along the y-axis, are associated with genetic variation plotted by genomic position on the x-axis. The prominent diagonal band indicates local eQTLs. (B) Local eQTL peaks generally fell within 1 Mb of the gene's genomic location, with the most significant eQTLs also being the most accurate.


