
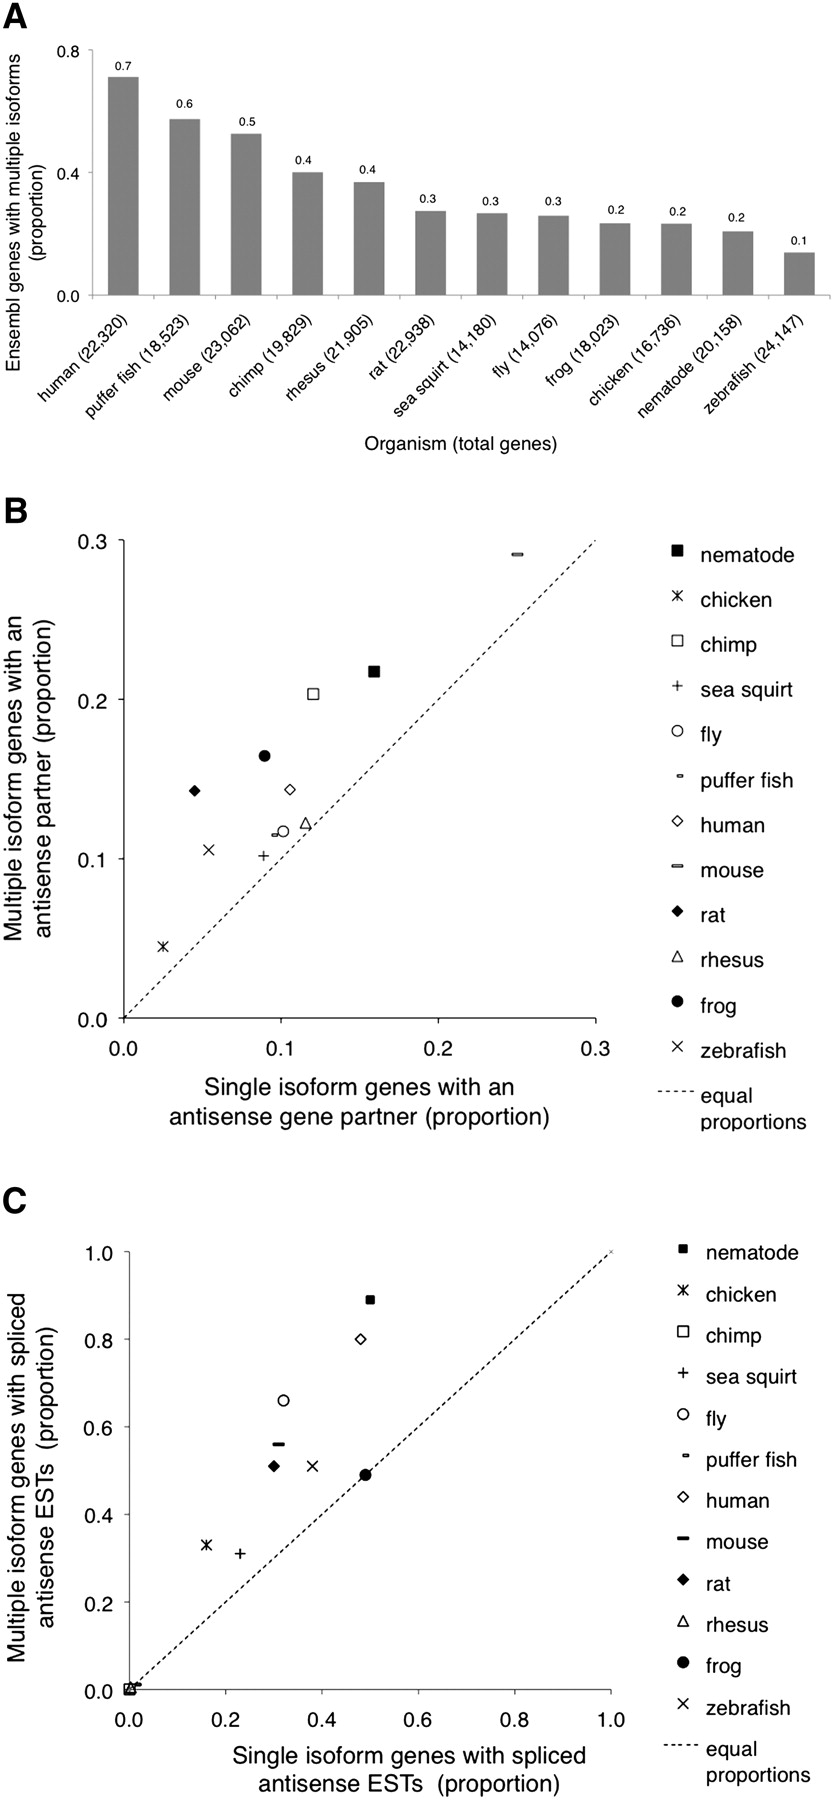
Figure 6.
High concordance between alternative splicing and antisense transcription in multiple species. (A) The proportion of all genes with multiple isoforms in twelve species. (B) Genes with multiple isoforms are enriched in known SAS pairs and (C) in EST evidence for novel antisense transcription (novel SAS genes). The dotted lines represent equal proportions of SAS genes or antisense ESTs among genes with multiple or single isoforms. Note that some organisms have very few ESTs (see Supplemental Table 4B).


