
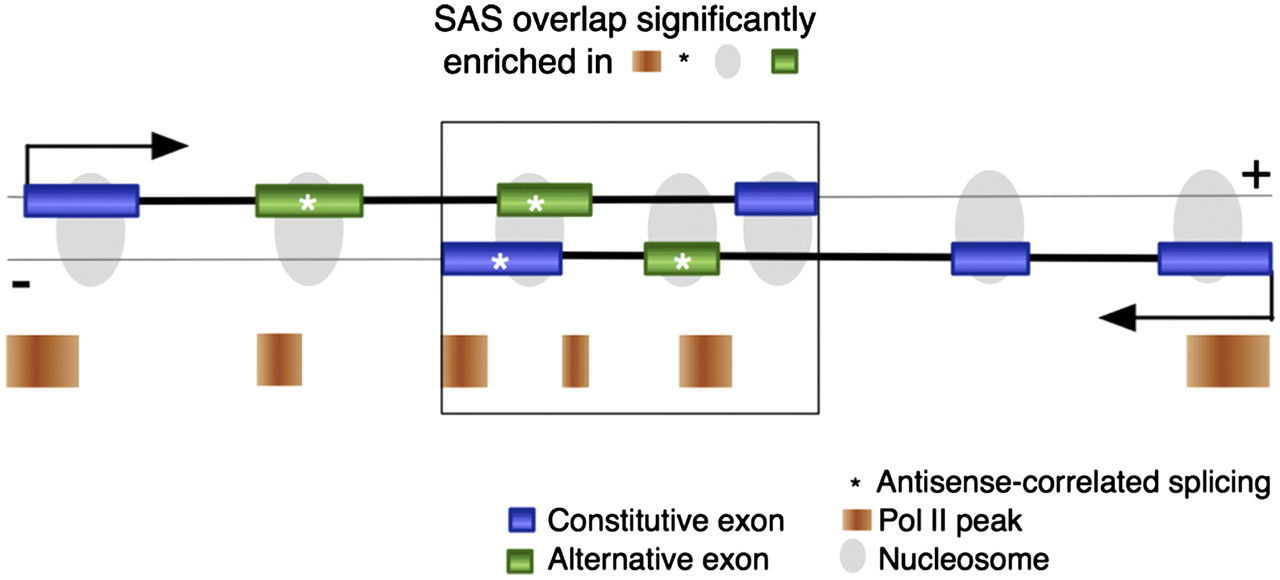
Figure 5.
Model of distinct features enriched in SAS overlapping regions. Features over-represented in the SAS overlap (large rectangle) include exon frequency (blue or green rectangles connected by a thick black line), the proportion of alternative (green) versus constitutive (blue) exons, Pol II peak frequency (orange rectangles), and the proportion of exons with antisense-correlated splicing patterns (*). Nucleosomes (gray ovals) are localized to exons and are therefore enriched in the area of SAS overlap. (Black arrows) Transcriptional direction.


