
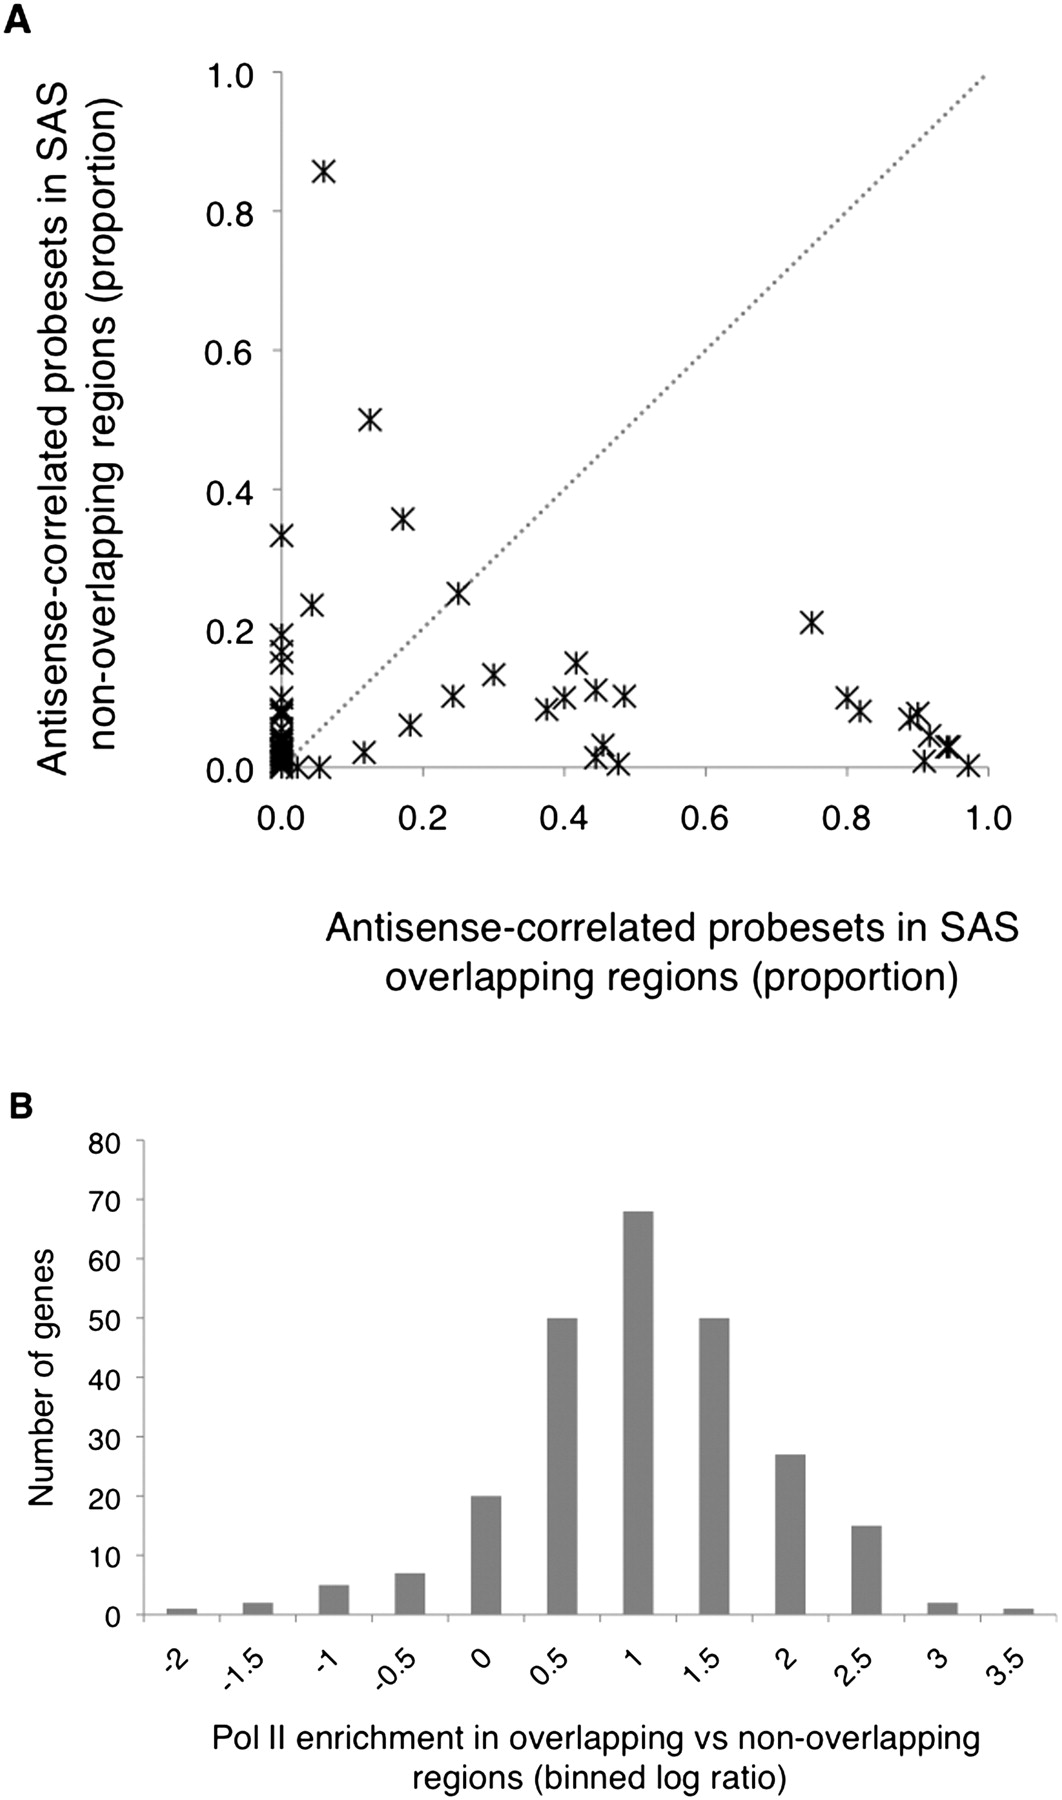
Antisense-correlated splicing events and Pol II occupancy levels are enriched in SAS overlaps. (A) The x-axis coordinate of each gene shows the corrected fraction of all expressed overlapping exons with antisense-correlated splicing. The y-axis shows the corrected fraction of all expressed nonoverlapping exons with antisense-correlated splicing. The fraction of probesets inside and outside the regions of overlap were corrected for overall number of probesets (as in Methods). The gray (dotted) line represents equal proportions of antisense-correlated overlapping and nonoverlapping probesets (B). The log10 ratios of overlapping versus nonoverlapping Pol II peaks/kilobase for 248 known SAS genes reveals Pol II enrichment in SAS overlaps (log ratios >0) at the majority of genes.


