
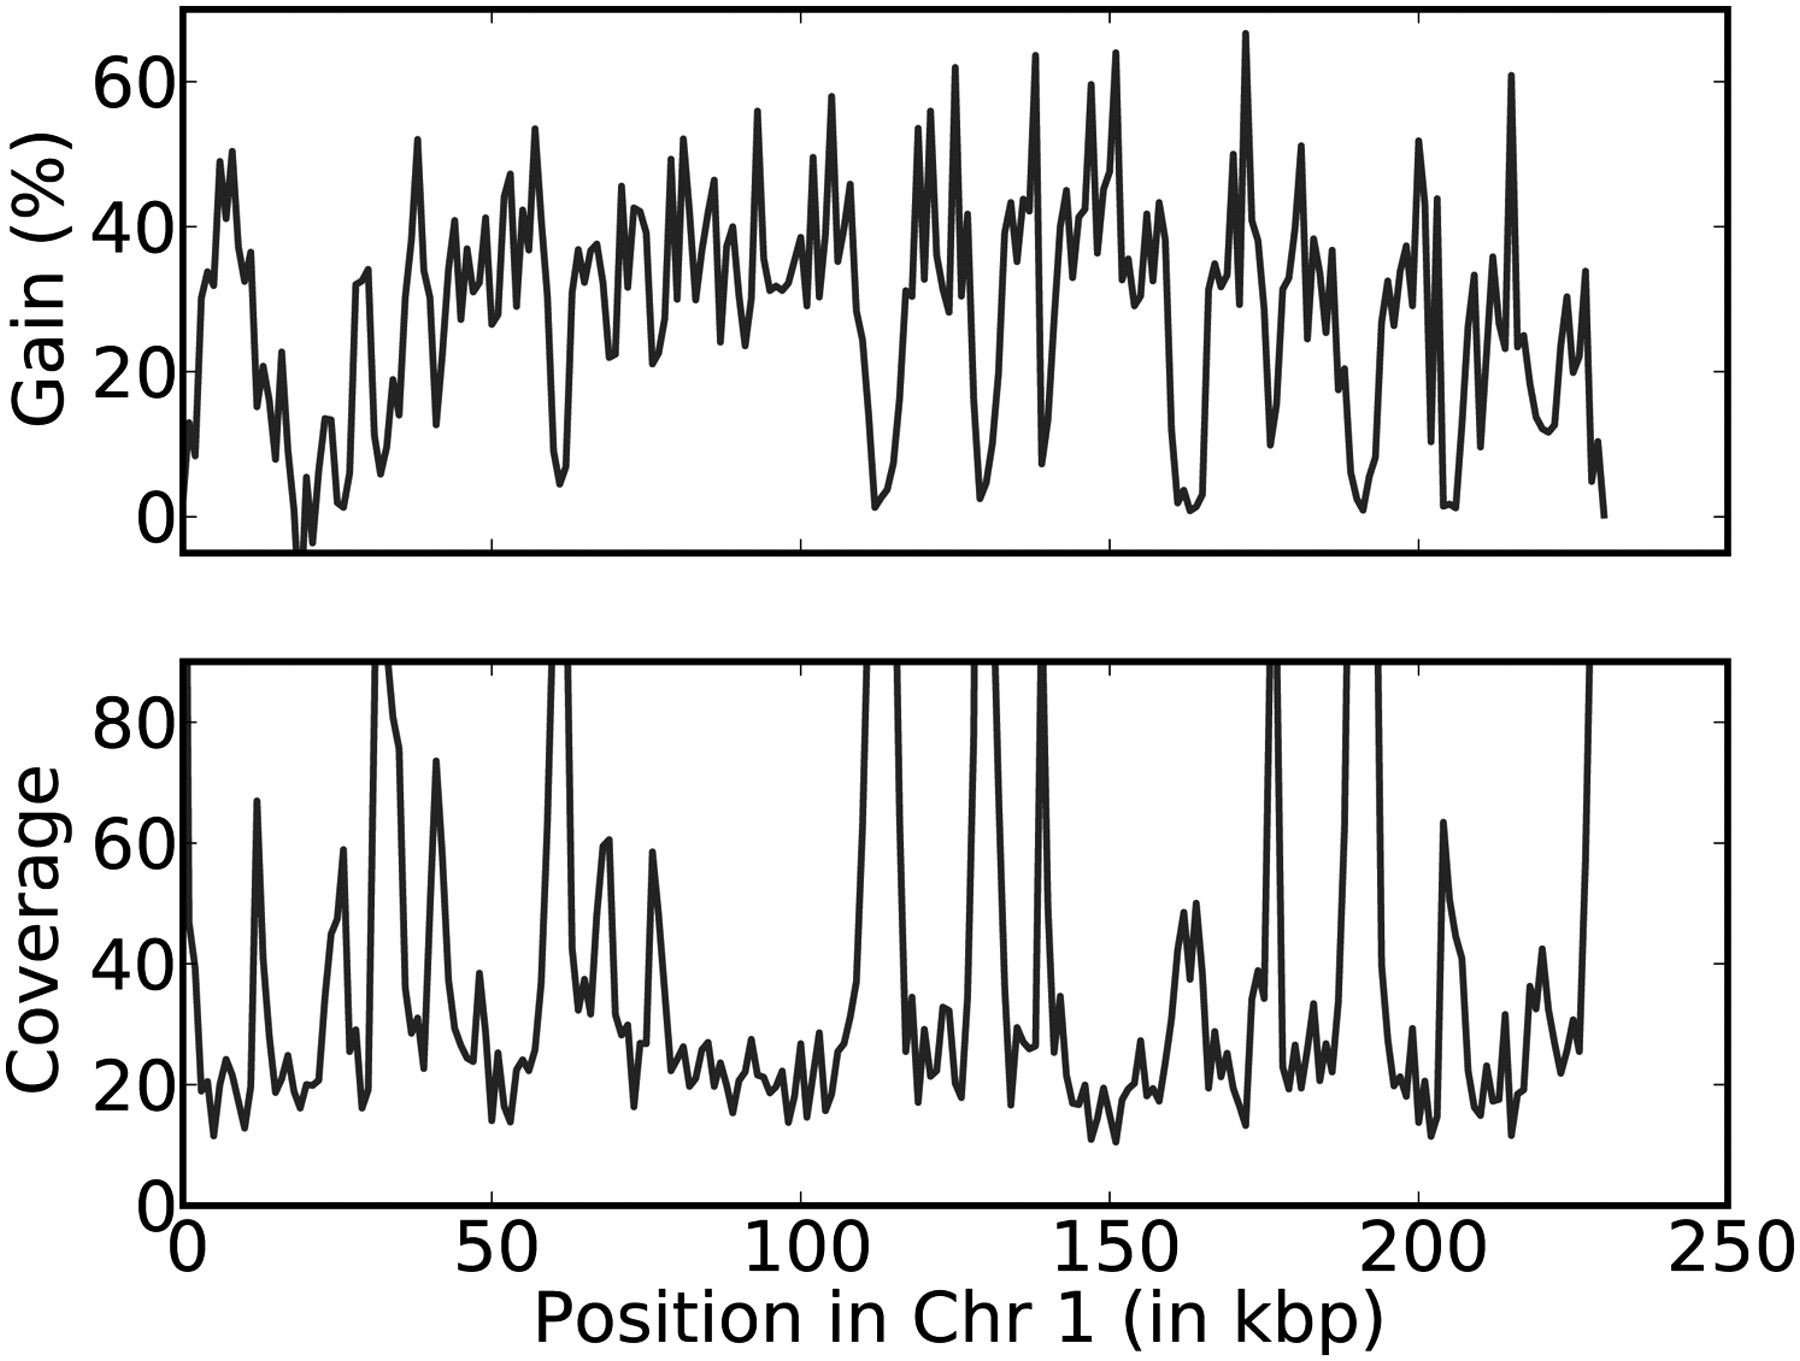
Figure 4.
The gain of ECHO and the position-specific coverage for chromosome 1 of the yeast data D6. Each plot uses bins of 1000 bp. The top plot shows the gain of ECHO, defined as the number of corrected errors minus the number of introduced errors, divided by the number of actual errors. The bottom plot shows the position-specific coverage.


