
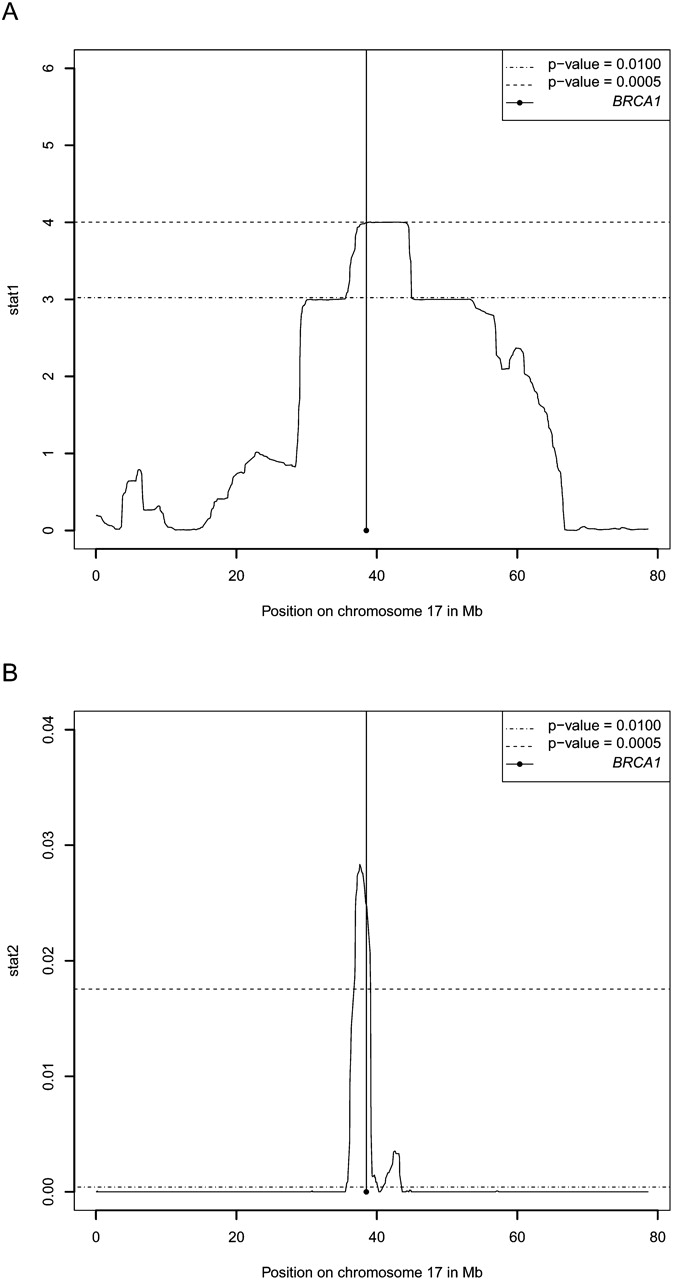
Figure 7.
P-values based on two different statistics, stat1 and stat2. (A) P-values based on stat1, which is the posterior expected number of cases that share at least one chromosome IBD in each locus. (B) P-values based on stat2, which is a simple indicator of whether or not all cases share at least one allele IBD. All P-values are corrected for multiple testing.


