
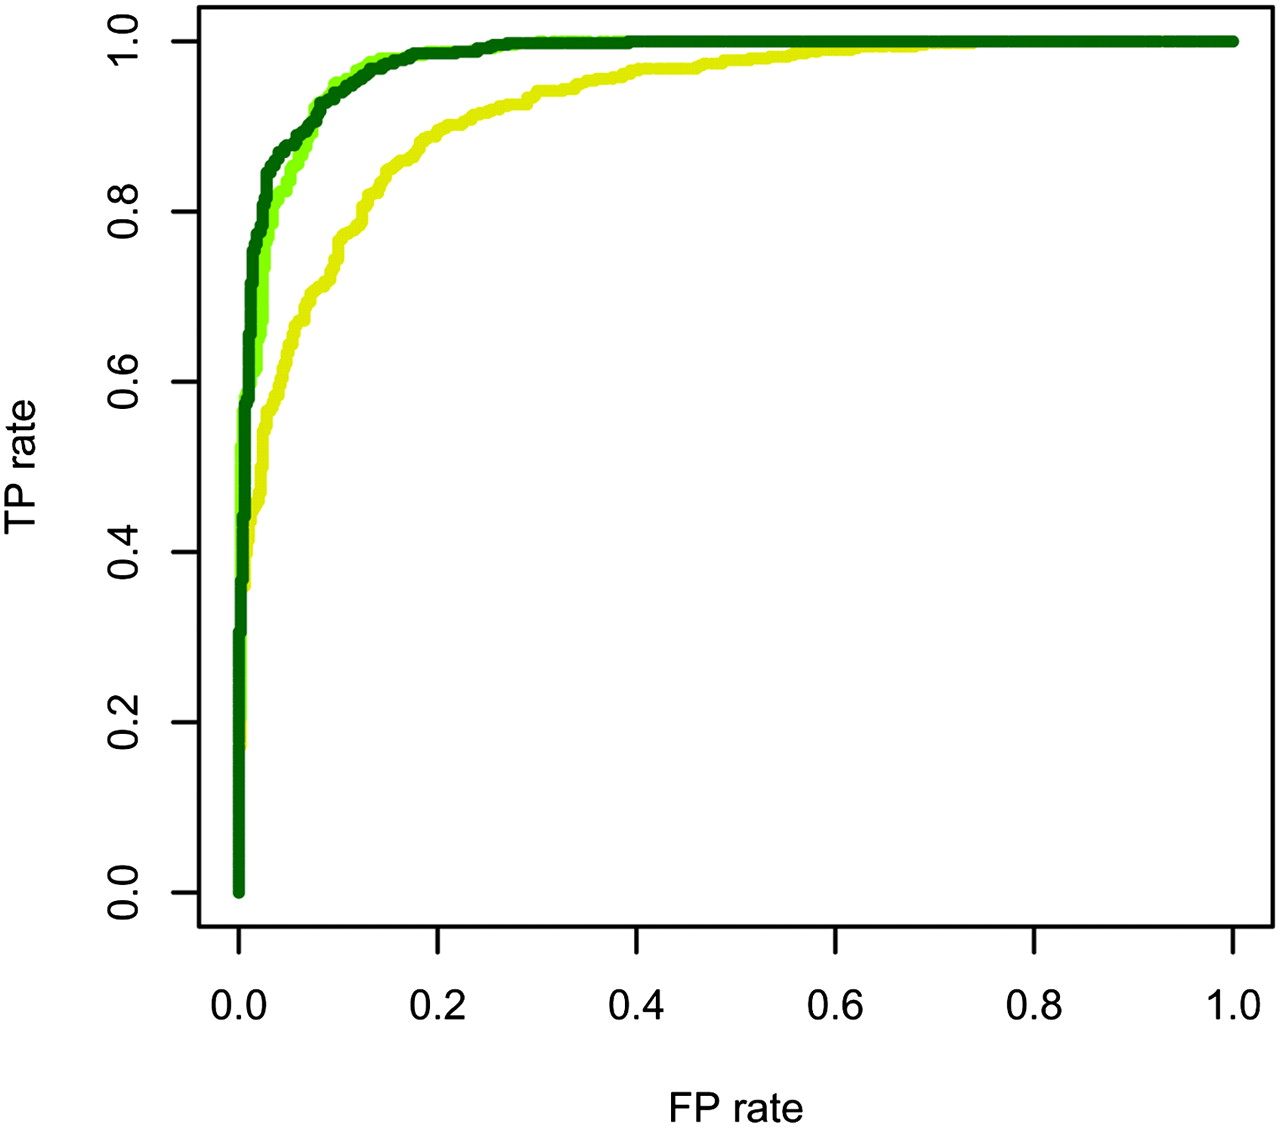
Figure 5.
ROC curves for scenarios 4a, 4b, and 4c using the MCMC method. The curves for scenario 4a (dark green), 4b (light green), and 4c (yellow) were all calculated with an inference criterion of 95% SNPs detected.
(Downloading may take up to 30 seconds. If the slide opens in your browser, select File -> Save As to save it.)
Click on image to view larger version.
ROC curves for scenarios 4a, 4b, and 4c using the MCMC method. The curves for scenario 4a (dark green), 4b (light green), and 4c (yellow) were all calculated with an inference criterion of 95% SNPs detected.
 CiteULike
 Delicious
 Digg
Digg Facebook
 Google+
 Reddit
 Twitter
