
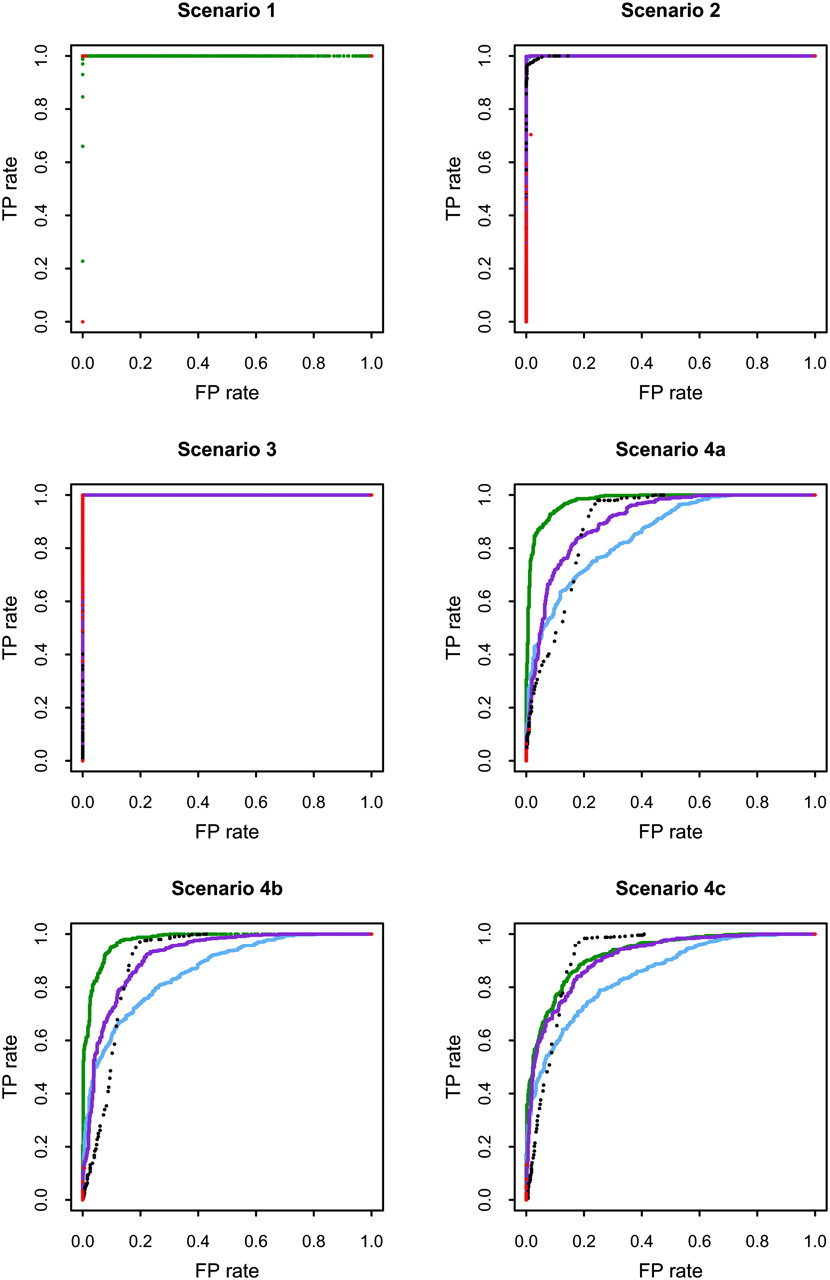
ROC curves for the six scenarios. The definition used for calling an IBD region inferred for these curves is when at least 95% of the SNPs in the region are inferred to be IBD. The green points are from the MCMC method, the purple points are from Relate, the blue points are from PLINK, the red points are from BEAGLE, and the black points are from GERMLINE. The green and blue points are almost not visible in the plots for scenarios 2 and 3 because the purple points cover them. The red points are difficult to see in several of the plots, because in these plots the amount of unique points is very low. It should be noted that BEAGLE is based on a model that is highly dependent on the presence of LD, and therefore has the potential to perform much better than it does in this test if applied to data with LD.


