
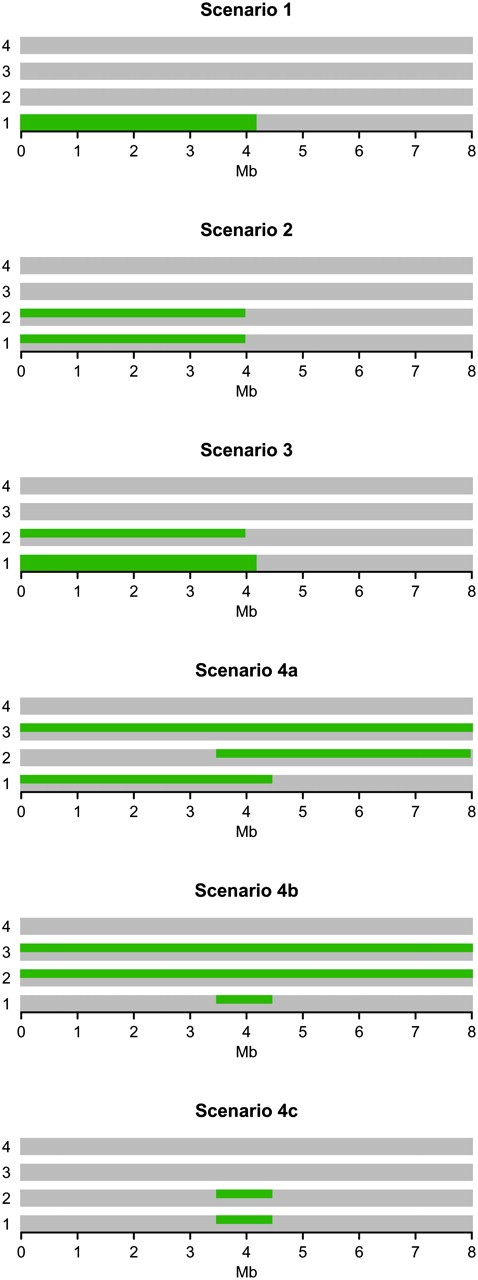
Figure 3.
The IBD scenarios used in the power analysis. For each of the scenarios there is one colored line for each of the eight chromosome sequences. In addition, each column represents a locus in the data set. If a chromosome sequence in a given locus is green it means that it is shared IBD with all the other chromosome sequences of this color in that locus. If it is gray, it means that it is not IBD with any of the other chromosomes.


