
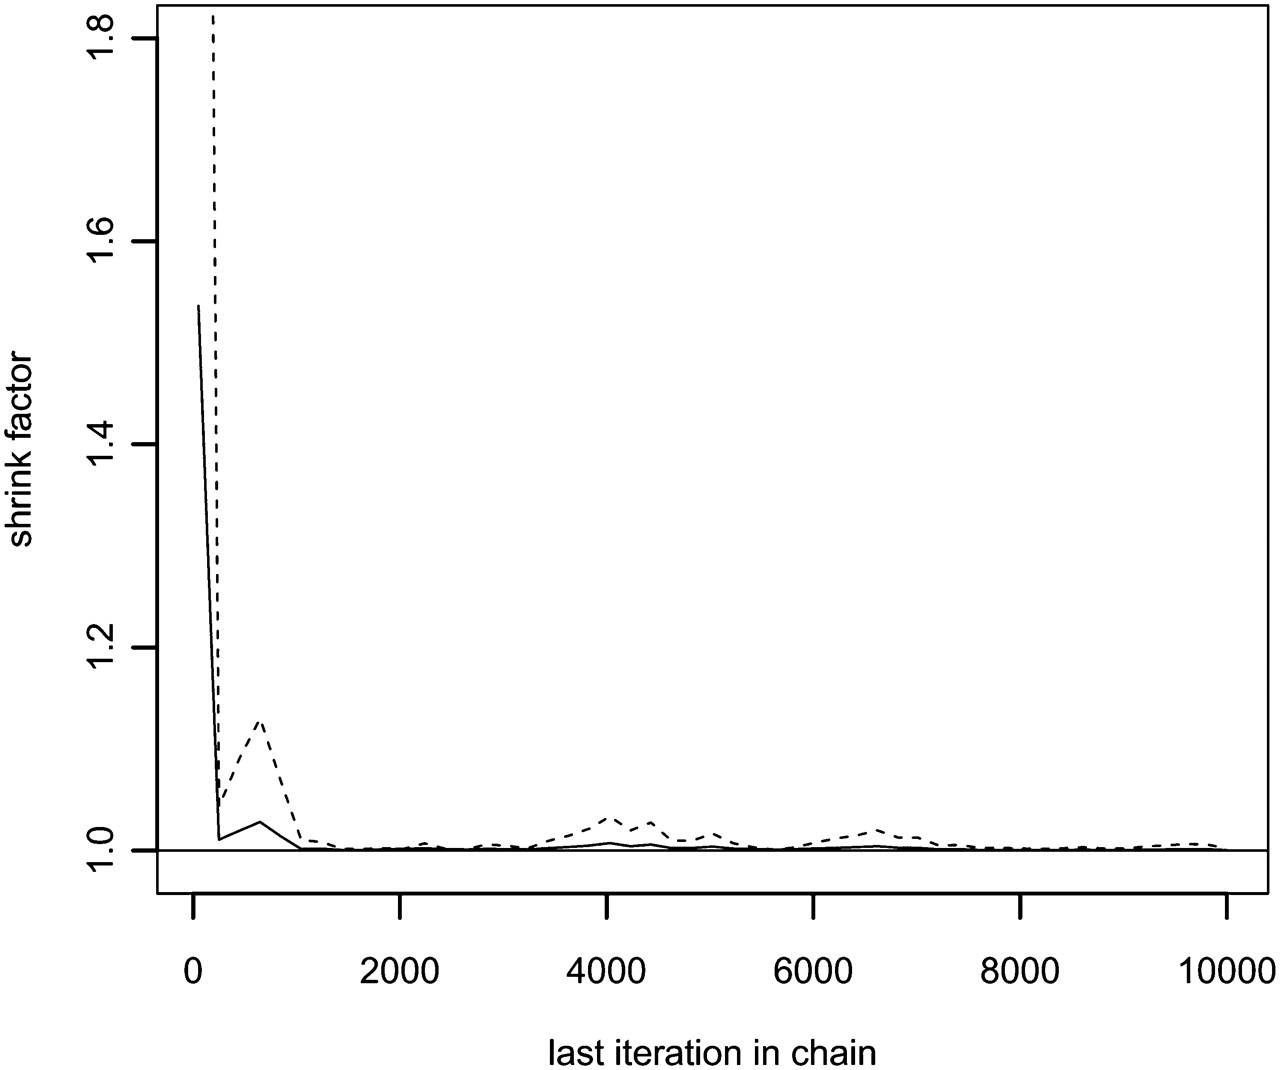
Gelman-Rubin plot based on the number of zeros in the sampled IBD configurations. The MAP estimates that the inference it was based on is only a summary statistic in the sense that it summarizes all samples in one overall statistic per locus and not a statistic for each sample. Hence, it cannot be used for convergence monitoring. Instead, we used the number of zeros in the IBD configuration since this, at least to some extent, captures the state of the entire IBD configuration. The solid line is the Gelman-Rubin “potential scale reduction factor” and the dashed line is the upper 95% confidence limit of the “potential scale reduction factor.”


