
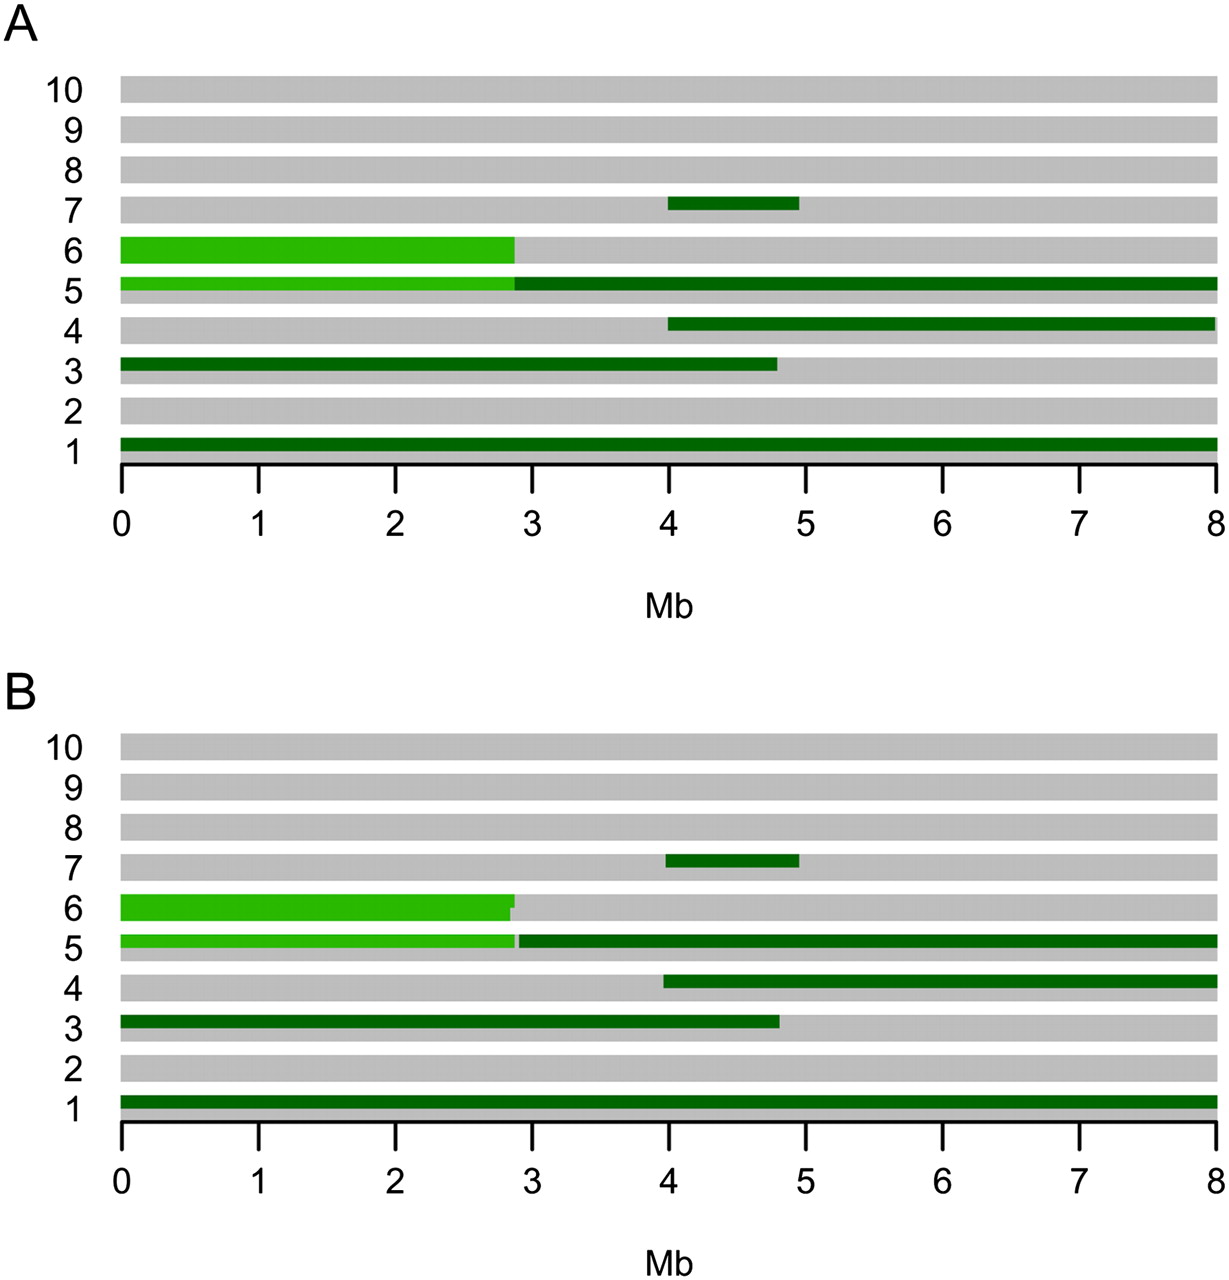
The example run. (A) The overall IBD configuration from which a data set with 10 individuals was simulated. There is one colored line for each of the 20 chromosome sequences and each column represents a locus in the data set. If a chromosome sequence in a given locus is light green or dark green, it means that it is shared IBD with all of the other chromosome sequences of the same color in that locus. If it is gray, it means that it is not IBD with any of the other chromosomes. (B) The inferred IBD configuration when the MCMC method is applied to the simulated data set. For each locus, the figure depicts the IBD set partitioning with the highest posterior probability, i.e., the estimated MAP IBD set partition. The specificity is 0.999 and the sensitivity is 0.998.


