
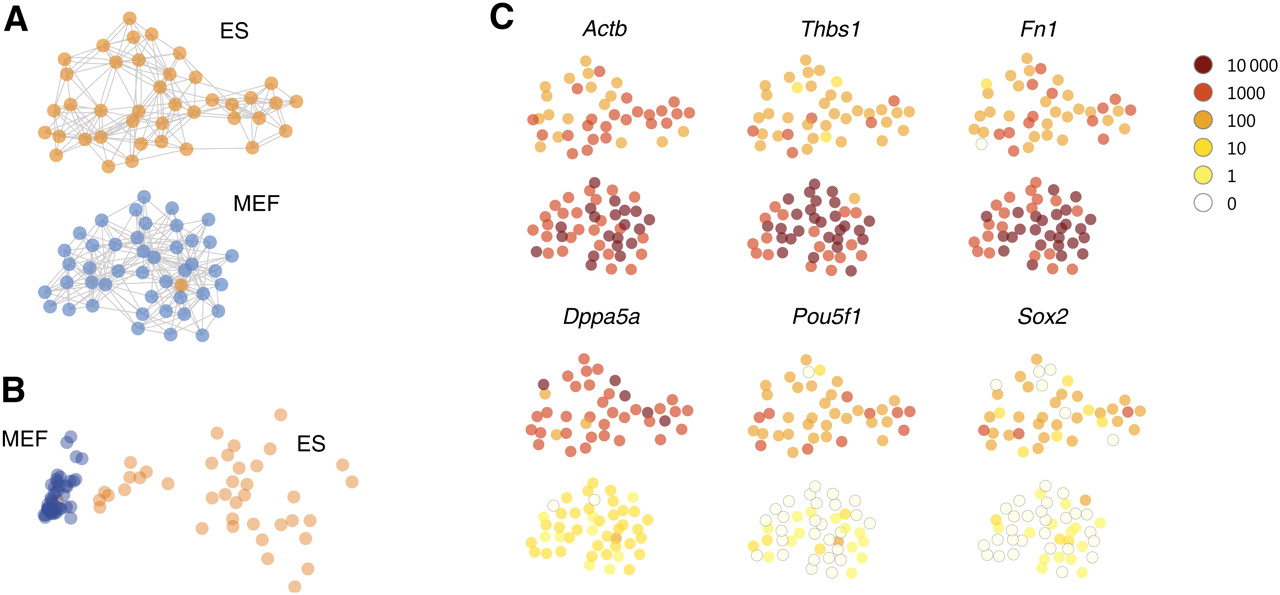
Graph-based visualization (“cell map”). (A) Cells, represented by graph nodes (circles) were laid out randomly, and edges (gray lines) were drawn from each cell to the five other cells it was most highly correlated with. Then, a force-directed layout was used to lay out the graph on the plane. In this stage, cells repelled each other uniformly but were held together by edges acting as elastic springs. The resulting visual map was consistent with known cell identities (ES cells in orange, MEFs in blue), with a single apparently misplaced cell. Note the lack of edges connecting the clusters, showing that the graph has separated into disjoint components. (B) The same data analyzed by principal component analysis (PCA), again with a single apparently misplaced cell but with less distinct separation by cell type. (C) The expression of selected genes is shown on a logarithmic color scale (inset, upper right). The top row shows genes enriched in MEFs, while the bottom row shows genes enriched in ES cells and known to be ES cell markers


