
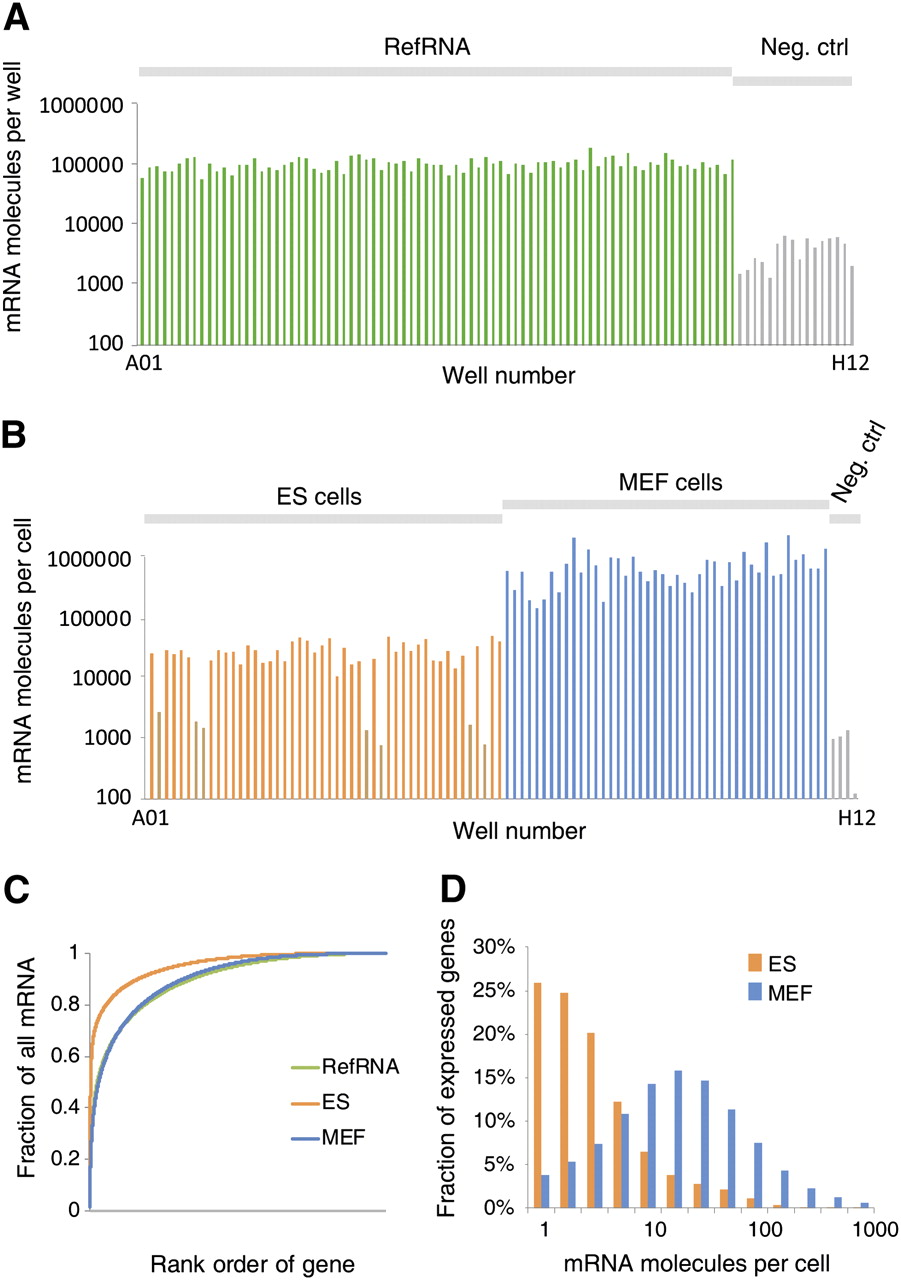
Number of mRNA molecules detected per cell. Approximately 2500 molecules of eight synthetic control mRNAs were spiked into each well. Using the number of reads mapped to synthetic mRNA as a normalizing factor, we converted the raw read counts from each well to an absolute number of mRNA molecules. The figures show the molecule count for each cell ordered by position on the reaction plate. (A) Molecule counts obtained from brain reference total RNA at 10 pg per well. The average observed was 103,000 molecules per well (negative controls: 4300 per well). (B) Molecule counts obtained from cells. A total of 48 ES cells, 44 MEF cells, and four empty wells were included. The overall average was 241,000 per cell (negative controls: 841 per cell). Seven wells apparently failed (molecule numbers similar to the negative controls, shown in pale orange), and were omitted from further analysis. (C) The cumulative fraction of all mRNA as a function of rank order gene expression level. Apparently, a smaller number of genes was expressed, compared with MEFs and RefRNA. (D) The distribution of gene copy number across all genes and cells.


