
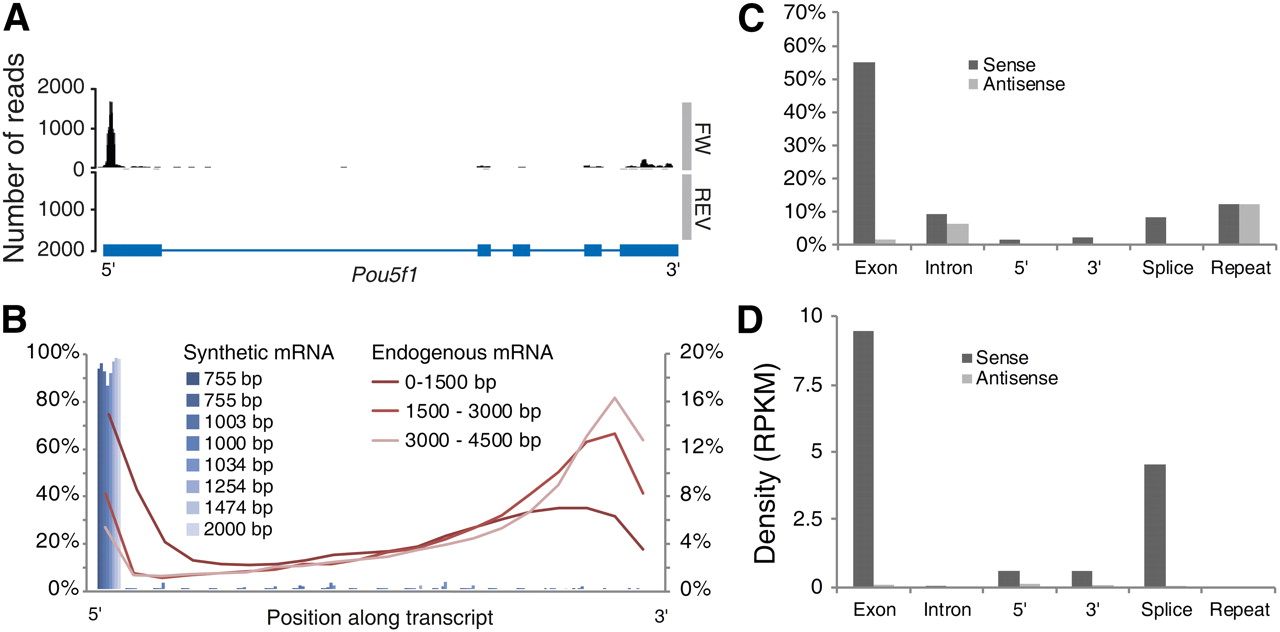
Read distribution. (A) Example of reads mapped to both strands of the 5-kb Pou5f1 locus, shown as a coverage plot. The gene structure is shown in blue below the graph. Most reads aligned near the 5′ end of the gene. (B) Density of reads as a function of the position along the transcript, in 5% length bins. The figure shows eight synthetic mRNA (blue bars) and averages for all genes categorized by transcript length as indicated. (C) Read-mapping statistics, showing the fraction of all mapped reads that overlapped each type of annotation (cf. Fig. 1B). The vertical scale shows the percentage of all reads that mapped to exons, introns, splice junctions, 1000 bp upstream of and 1000 bp downstream from transcriptional units, and known repeats. In each case, the black bar shows reads mapped in the sense orientation, and the gray bar shows reads mapped in antisense. Repeats were not directionally annotated and therefore were hit equally on both strands. (D) The same statistics as in C but normalized for the total length of each feature class, expressed as RPKM. This shows more clearly the level of enrichment of exons versus introns, demonstrating good specificity for mRNA and rejection of genomic DNA and/or inspliced intronic RNA.


