
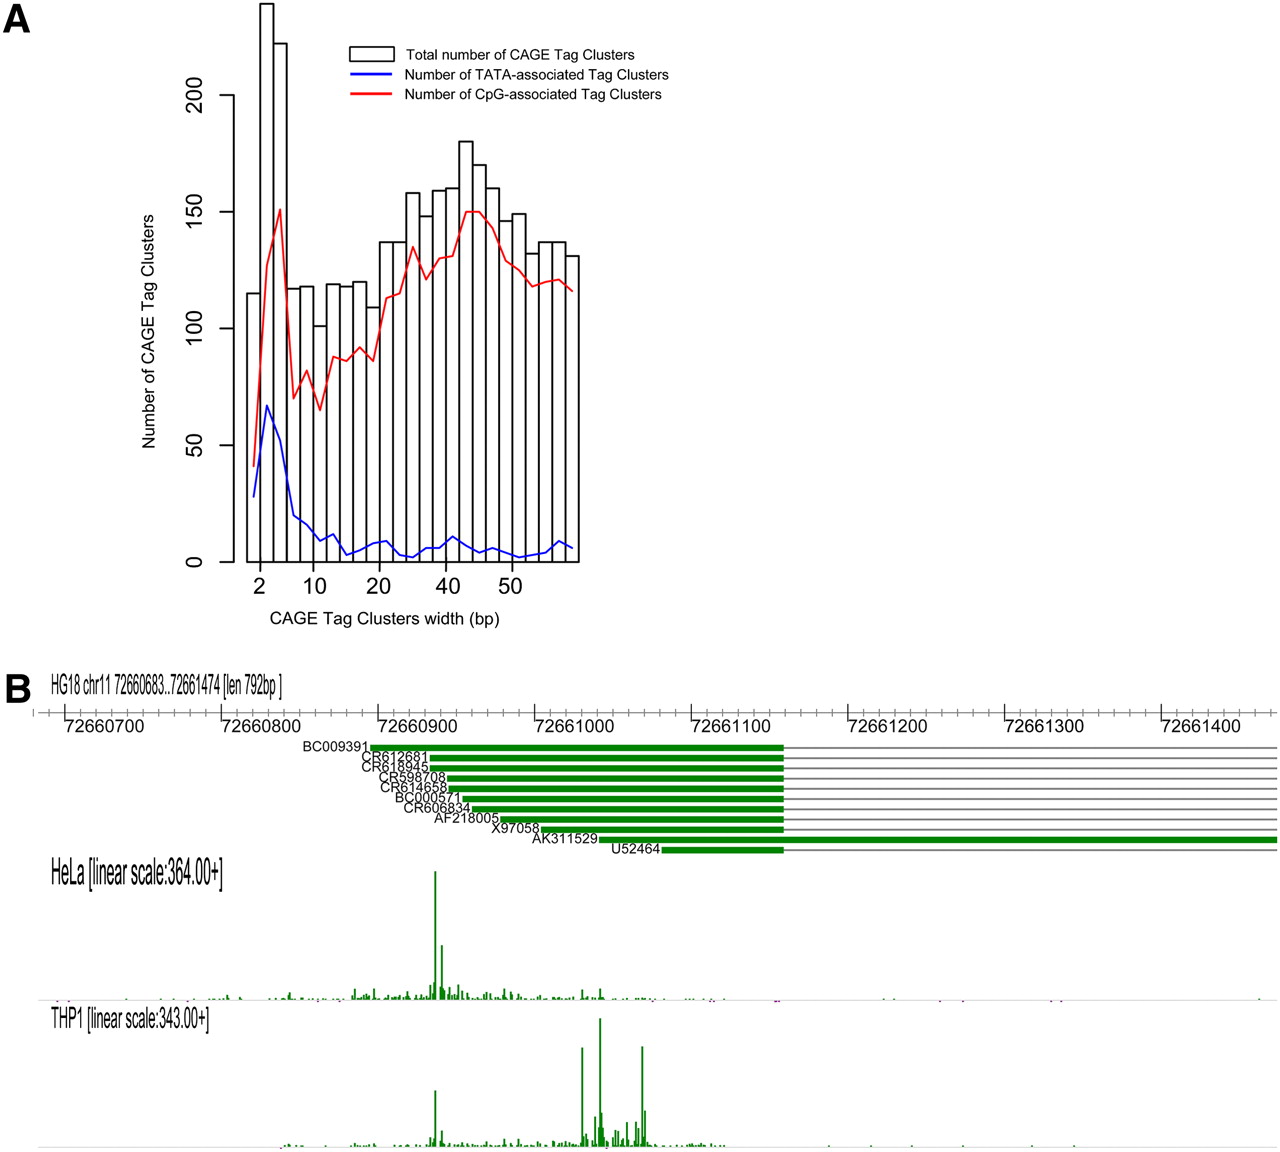
Figure 4.
Distribution of HeliScopeCAGE signal within transcription initiation regions. (A) Width distribution of Tag Clusters. CpG and TATA association are shown as blue and red lines, respectively. (B) Fine level TSS preference differences between HeLa and THP-1 in the P2RY6 locus are revealed by HeliScopeCAGE.


