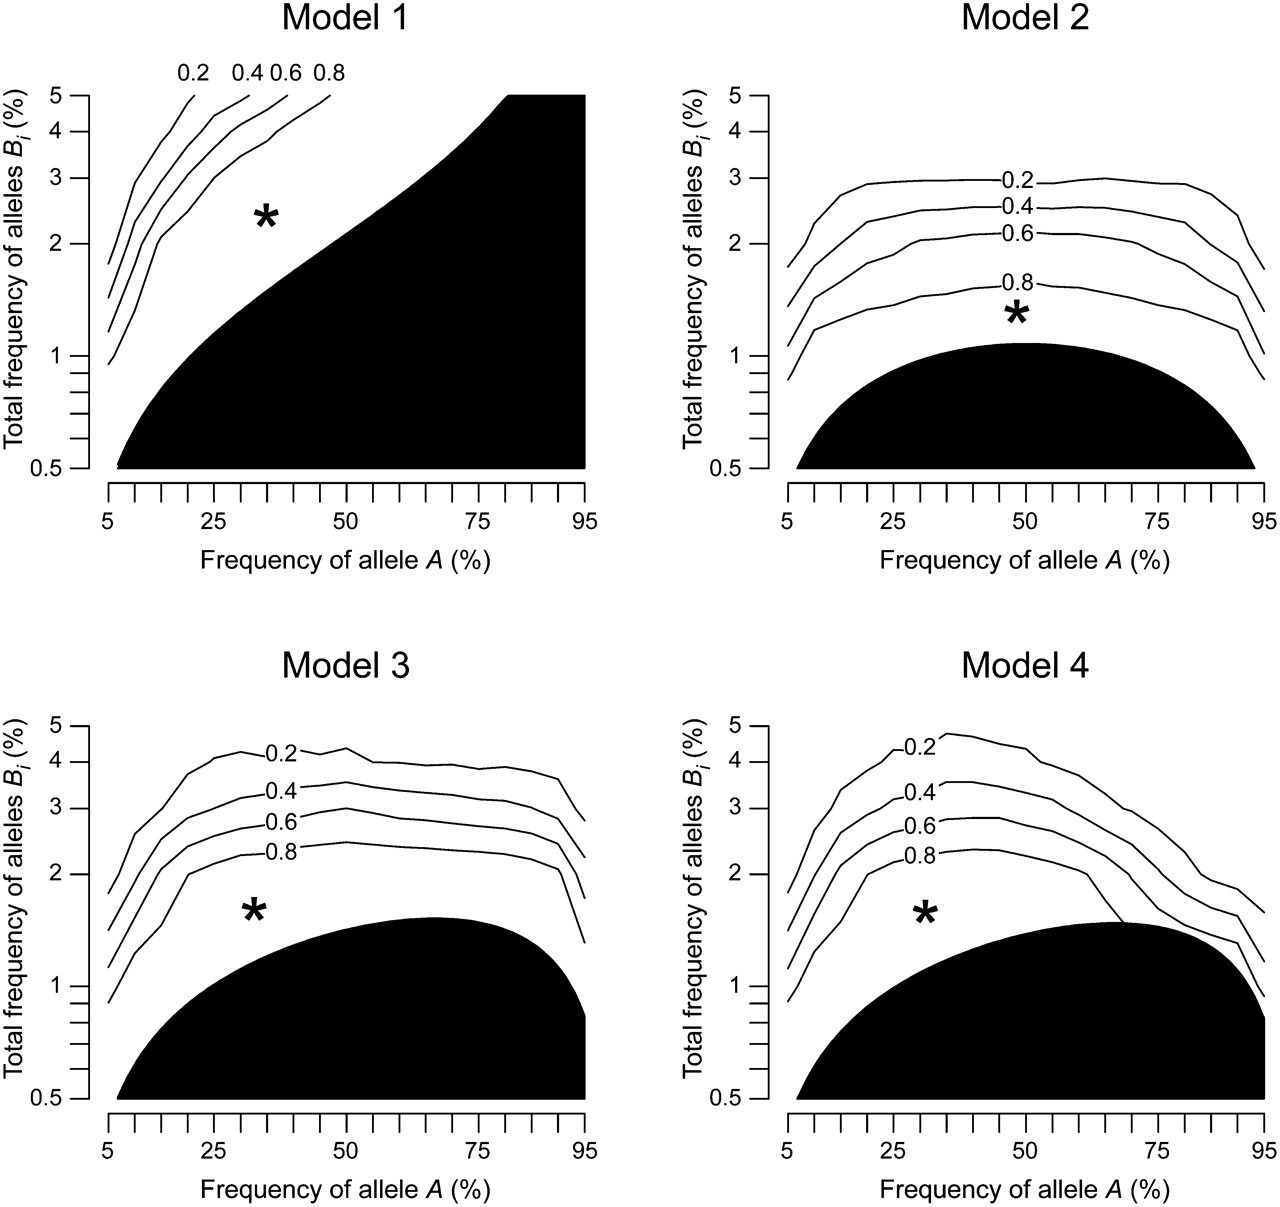
Detection of common single nucleotide polymorphisms synthesizing quantitative trait association of rarer causal variants

(Downloading may take up to 30 seconds. If the slide opens in your browser, select File -> Save As to save it.)

Click on image to view larger version.

Figure 5.
Figure 5.

Power for detecting synthetic association by the combined test of heteroscedasticity and skewness. The power was computed from simulation under four representative genetic models, assuming the strength of marker association (R2mrk) of 0.00592. The format of the figure is the same as Figure 3.

This Article

  1. Genome Res. 21: 1122-1130

Preprint Server